Gold Price Forecast: XAU/USD eyes more upside amid trade woes, technical breakout
- Gold price prints monthly highs near $3,400 early Tuesday, then retreats.
- The US Dollar comes up for air after Monday’s sell-off on renewed trade concerns.
- Gold price breaks through the key resistance line on the daily chart amid bullish RSI.

Gold price is on a modest pullback from the monthly high of $3,392 reached in Tuesday’s early Asian trades. The focus is back on the US JOLTS Job Openings data while trade headlines will continue to remain the primary market driver.
Gold price to keep benefiting from trade and geopolitical fears
Despite the latest retreat, Gold price will likely remain underpinned by renewed tensions over US President Donald Trump’s latest tariff announcement and rekindling US-China trade rift.
Ever since Trump announced on Friday that he would double import tariffs on steel and aluminium to 50% in a bid to “even further secure the steel industry in the United States (US)”, the US Dollar (USD) has been on the receiving end amid renewed fears over the economy and policies uncertainty.
Further, trade concerns intensified after Trump accused China of violating its agreement with the US to mutually roll back tariffs and holding back products essential to the industrial supply chain., in a post published on Truth Social on Friday.
Moreover, Reuters reported on Monday that The Trump administration is reportedly working on delivering a final trade deal deadline set for this Wednesday.
However, early Tuesday, USD sellers seem to be taking a breather, limiting the Gold price upside. Traders could be covering their USD short positions, gearing for a slew of critical US employment data this week, with the JOLTS Job Openings Survey due later in the day.
Strong US jobs data could back the Federal Reserve’s (Fed) prudent policy approach and aid the Greenback’s recovery, impeding the renewed Gold price uptrend toward record highs.
That said, the daily technical setup for Gold price continues to indicate strong gains in the near term.
Gold price technical analysis: Daily chart
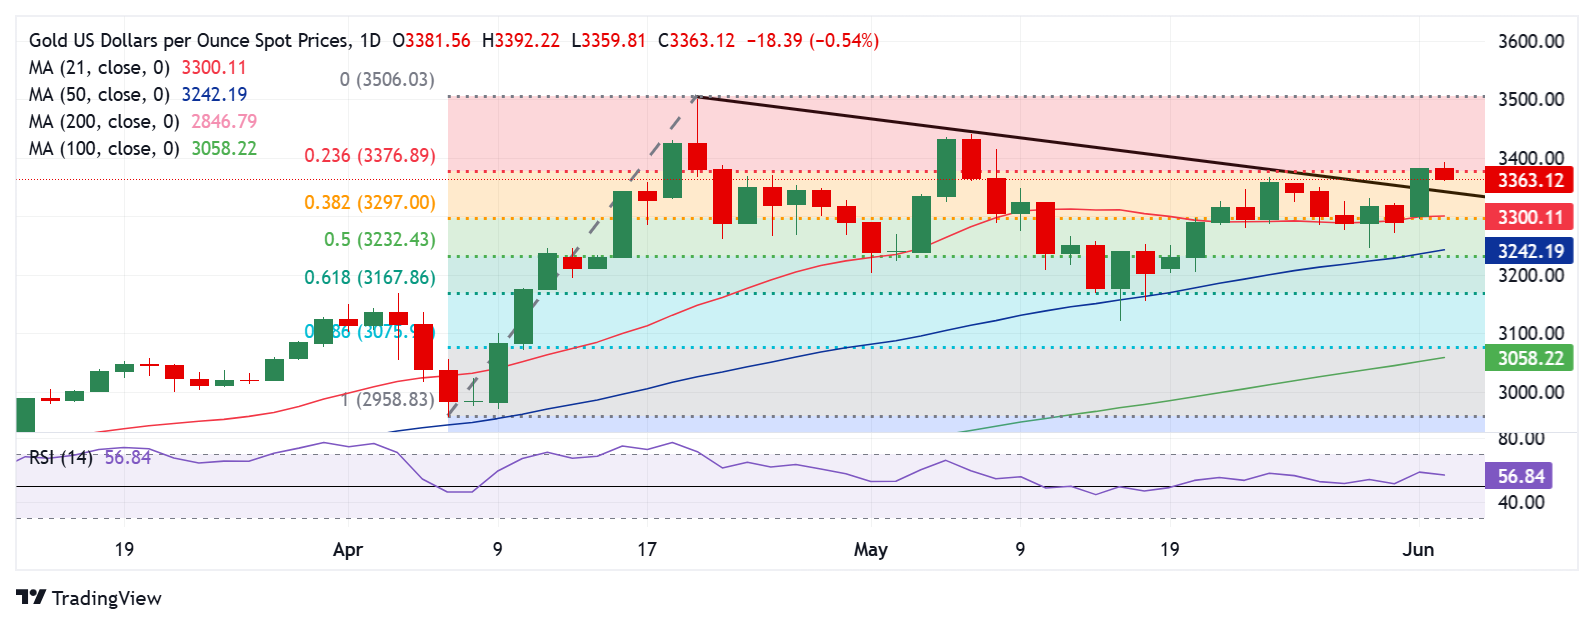
Having firmly defended the 21-day Simple Moving Average (SMA), Gold price stormed through the falling trendline resistance, then at $3,346, to finish Monday at $3,382.
At the moment, Gold price is struggling yet again with $3,377, the 23.6% Fibonacci Retracement (Fibo) level of the April record rally.
Buyers yearn for acceptance above the $3,400 threshold to resume the recent upswing toward the lifetime highs of $3,500.
Ahead of that, the May high of $3,439 must be scaled on a sustained basis.
The 14-day Relative Strength Index (RSI) points lower but holds comfortably above the midline, supporting bullish bias.
Conversely, the correction could gather steam on a decisive break below the falling trendline resistance-turned-support, now at $3,341.
The next support is seen at the confluence of the 21-day SMA and the 38.2% Fibo level near $3,300.
Gold sellers could then accelerate declines toward the 50% Fibo level near $3,232 where the 50-day SMA hangs around.
Gold FAQs
Gold has played a key role in human’s history as it has been widely used as a store of value and medium of exchange. Currently, apart from its shine and usage for jewelry, the precious metal is widely seen as a safe-haven asset, meaning that it is considered a good investment during turbulent times. Gold is also widely seen as a hedge against inflation and against depreciating currencies as it doesn’t rely on any specific issuer or government.
Central banks are the biggest Gold holders. In their aim to support their currencies in turbulent times, central banks tend to diversify their reserves and buy Gold to improve the perceived strength of the economy and the currency. High Gold reserves can be a source of trust for a country’s solvency. Central banks added 1,136 tonnes of Gold worth around $70 billion to their reserves in 2022, according to data from the World Gold Council. This is the highest yearly purchase since records began. Central banks from emerging economies such as China, India and Turkey are quickly increasing their Gold reserves.
Gold has an inverse correlation with the US Dollar and US Treasuries, which are both major reserve and safe-haven assets. When the Dollar depreciates, Gold tends to rise, enabling investors and central banks to diversify their assets in turbulent times. Gold is also inversely correlated with risk assets. A rally in the stock market tends to weaken Gold price, while sell-offs in riskier markets tend to favor the precious metal.
The price can move due to a wide range of factors. Geopolitical instability or fears of a deep recession can quickly make Gold price escalate due to its safe-haven status. As a yield-less asset, Gold tends to rise with lower interest rates, while higher cost of money usually weighs down on the yellow metal. Still, most moves depend on how the US Dollar (USD) behaves as the asset is priced in dollars (XAU/USD). A strong Dollar tends to keep the price of Gold controlled, whereas a weaker Dollar is likely to push Gold prices up.
Premium
You have reached your limit of 3 free articles for this month.
Start your subscription and get access to all our original articles.
Author

Dhwani Mehta
FXStreet
Residing in Mumbai (India), Dhwani is a Senior Analyst and Manager of the Asian session at FXStreet. She has over 10 years of experience in analyzing and covering the global financial markets, with specialization in Forex and commodities markets.


