Gold Price Forecast: XAU/USD eyes additional declines amid firmer yields, $1,806 support holds the key
- Gold price holds the lower ground as US Treasury yields sit at the two-year top.
- Bets of more than 25-bps Fed rate hike March weigh on non-interest-bearing gold.
- Gold price remains vulnerable while within a symmetrical triangle on the 4H chart.

Gold price fell to a fresh five-day low of $1,807 on Tuesday, having faced rejection once again above $1,820. Sellers took over complete control after the US Treasuries got sold-off into aggressive Fed’s tightening bets, as the yields spiked across the curve. The benchmark 10-year US rates jumped to the highest level since January 2020, as investors reacted to Fed Governor Christopher Waller’s comments delivered on Friday. Waller said that he rules out a 50-basis point (bps) rate hike in March, which made markets speculate that some of the Fed policymakers did discuss a 50-bps lift-off. The return of the full market exaggerated the moves in the yields and gold price. Aggressive Fed rate hike expectations, however, weighed on the Wall Street sentiment, checking gold’s downside. Additionally, concerns over surging Omicron covid variant cases globally also helped gold price find a floor well above the $1,800 mark.
Gold price is attempting a tepid bounce so far this Wednesday, as the Treasury yields halt their latest leg higher, with the risk-off sentiment persisting at full steam. The US dollar eases across the board, lending some support to the bullion. The rebound in gold price appears shallow, as the yields and the dollar will continue to hold the upper hand amid the Fed speculation. Swap markets are already pricing in over 25 bps of tightening by the end of March. The sentiment around the yields will dominate markets in the day ahead, in absence of any high-tier US economic data on Wednesday. Meanwhile, the US housing data could offer some trading impetus to gold traders.
Gold Price Chart - Technical outlook
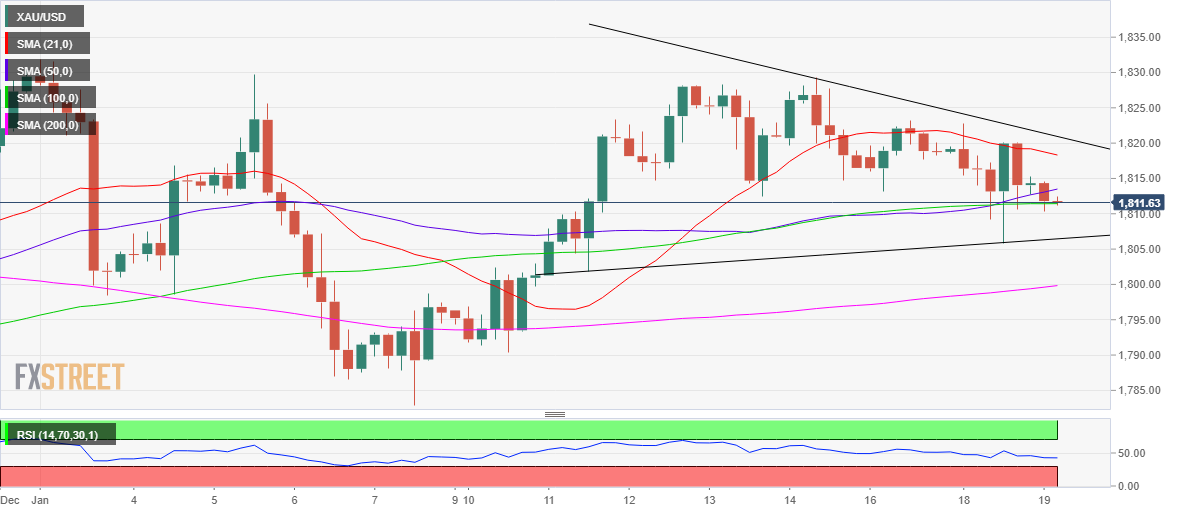
Gold: Four-hour chart
As observed on the four-hour chart, gold price is challenging the critical 100-Simple Moving Average (SMA) support at $1,811.
The Relative Strength Index (RSI) is inching lower below the midline, suggesting that there is more room for the downside.
A sustained move below the 100-DMA will fuel a fresh decline towards the rising trendline support at $1,806.
Gold price will chart a symmetrical triangle breakdown on a four-hourly candlestick closing below the latter, opening floors for a test of the upward-sloping 200-SMA at $1,800.
The last line of defense for gold buyers is seen at the January 10 lows of $1,790.
On the flip side, recapturing the bullish 50-SMA at $1,814 is critical for attempting any meaningful recovery.
The downward-pointing 21-SMA at $1,818 will then get tested, above which the falling trendline resistance at $1,821 will be eyed.
Further north, the previous day’s high of $1,823 will act as the next relevant upside barrier.
Author

Dhwani Mehta
FXStreet
Residing in Mumbai (India), Dhwani is a Senior Analyst and Manager of the Asian session at FXStreet. She has over 10 years of experience in analyzing and covering the global financial markets, with specialization in Forex and commodities markets.


