Gold Price Forecast: XAU/USD eyes acceptance above $3,380 as focus shifts to ISM Services PMI
- Gold price looks to extend the recovery into its fourth straight day on Tuesday.
- The US Dollar remains vulnerable amid increased rate cut bets, tariffs and Fed concerns.
- Gold price must close Tuesday above the key $3,380 resistance as the daily RSI stays bullish.

Gold price is flirting with weekly highs near $3,380 in the Asian trading hours on Tuesday, with buyers looking forward to the US ISM Services PMI data for a fresh boost.
Gold price looks north amid dovish Fed expectations
A surprisingly strong China’s Caixin Services PMI data, which came in at 52.6 in July, bolstered risk appetite.
Meanwhile, increased bets that the US Federal Reserve (Fed) will lower interest rates in September continue to underpin risk sentiment at the expense of the US Dollar (USD), keeping the non-yielding Gold price afloat.
Strong US labor data combined with San Francisco Fed President Mary Daly’s dovish remarks have almost sealed in a September Fed rate cut, with markets now pricing in a 90.5% probability of such a move, the CME Group’s FedWatch Tool shows.
The Bureau of Labor Statistics (BLS) reported Friday that the US economy added 73,000 jobs for July, above the June revision of 14,000 but below even the meagre estimate for a gain of 110,000. The Unemployment Rate ticked higher to 4.2% in the month, as expected.
Daly said on Monday, “we may do fewer than two cuts. The more likely thing is we need to do more.
“The job market is not precariously weak, but it is softening, and further softening would be unwelcome,” she added.
Additionally, concerns over the Fed’s independence and the credibility of economic data remain a drag on the Greenback.
US President Donald Trump fired the US Labor Department's statistical leader, Erika L. McEntarfer, after the weak jobs report on Friday.
Markets believe that the dismissal of BLS Commissioner Erika McEntarfer may be part of a broader strategy to undermine the credibility of official inflation data, eventually impacting the Fed’s independence.
These factors render positive for the bright metal, supporting its recovery from monthly troughs.
The next leg higher in Gold price, however, depends on the US ISM Services PMI data for July, which is seen rising to 51.5 from 50.8 in June.
Strong ISM data could shake off some of the recent dovishness surrounding the Fed’s next policy, lifting the USD while fuelling a brief corrective decline in Gold price.
A slowdown in the services sector could intensify concerns over the US economic resilience amid weakening labor market conditions, which could trigger a fresh USD downtrend, boosting the bullion.
Gold traders will also closely scrutinize trade headlines and Fedspeak for fresh trading incentives.
Gold price technical analysis: Daily chart
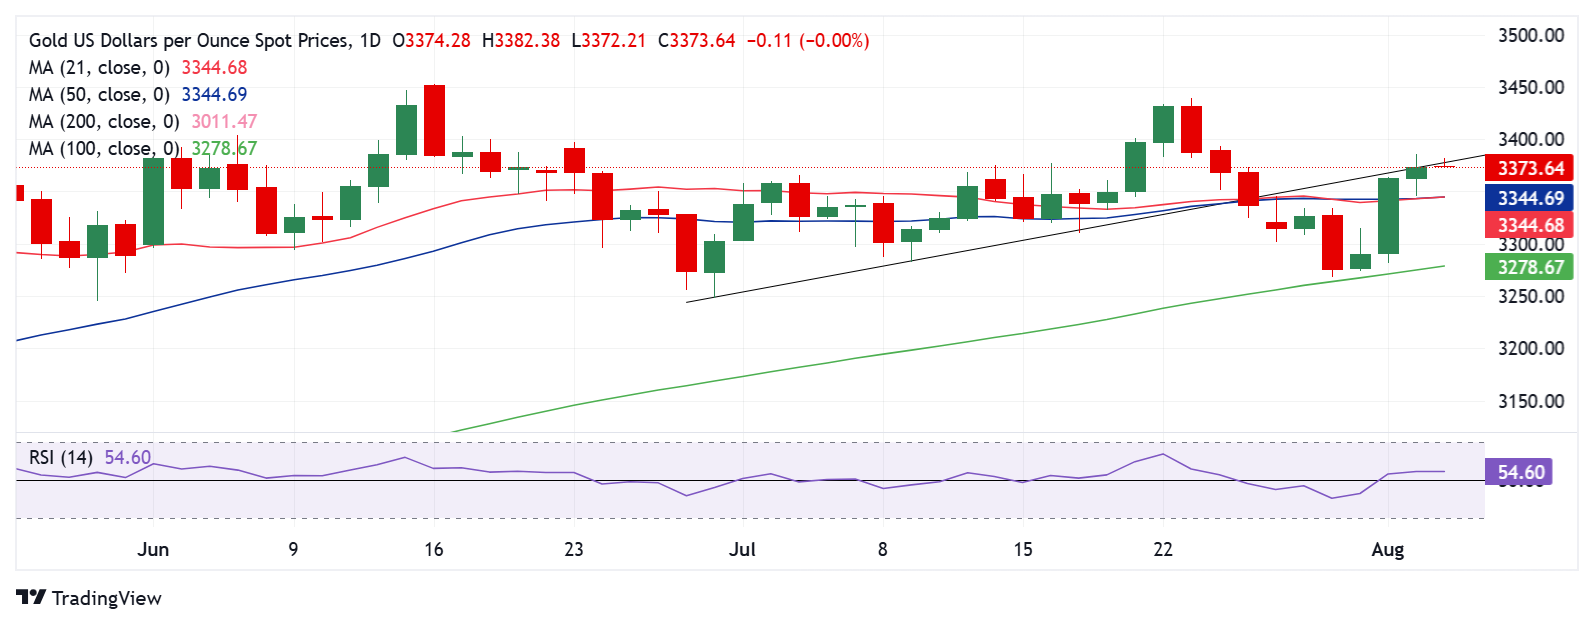
The daily chart shows that the technical setup remains in favor of Gold buyers.
The 14-day Relative Strength Index (RSI) is sitting above the midline, currently near 55, suggesting that any dip could be quickly bought into.
Adding credence to the bullish potential, the 21-day is primed to cross the 50-day SMA for upside, which if materialized on a daily closing basis will confirm a Bull Cross.
Gold buyers need a daily candlestick closing above the rising trendline support at $3,380 to regain the $3,400 threshold. Further, the $3,440 static resistance will come into play once again.
Conversely, strong support is placed at the 21-day SMA and 50-day SMA confluence near $3,345. A sustained move below that level will open up further downside toward the $3,300 round figure. The last line of defense for Gold buyers is the 100-day SMA at $3,279.
Economic Indicator
ISM Services PMI
The Institute for Supply Management (ISM) Services Purchasing Managers Index (PMI), released on a monthly basis, is a leading indicator gauging business activity in the US services sector, which makes up most of the economy. The indicator is obtained from a survey of supply executives across the US based on information they have collected within their respective organizations. Survey responses reflect the change, if any, in the current month compared to the previous month. A reading above 50 indicates that the services economy is generally expanding, a bullish sign for the US Dollar (USD). A reading below 50 signals that services sector activity is generally declining, which is seen as bearish for USD.
Read more.Next release: Tue Aug 05, 2025 14:00
Frequency: Monthly
Consensus: 51.5
Previous: 50.8
Source: Institute for Supply Management
The Institute for Supply Management’s (ISM) Services Purchasing Managers Index (PMI) reveals the current conditions in the US service sector, which has historically been a large GDP contributor. A print above 50 shows expansion in the service sector’s economic activity. Stronger-than-expected readings usually help the USD gather strength against its rivals. In addition to the headline PMI, the Employment Index and the Prices Paid Index numbers are also watched closely by investors as they provide useful insights regarding the state of the labour market and inflation.
Author

Dhwani Mehta
FXStreet
Residing in Mumbai (India), Dhwani is a Senior Analyst and Manager of the Asian session at FXStreet. She has over 10 years of experience in analyzing and covering the global financial markets, with specialization in Forex and commodities markets.