Gold Price Forecast: XAU/USD extends gains as risk aversion intensifies

XAU/USD Current price: $1,963.51
- Signs of a strong US labor market boosted speculation of additional rate hikes.
- Uncertainty surrounding the US debt-ceiling bill undermines the mood.
- XAU/USD holds on to gains, although a steeper advance is still out of the picture.
Spot Gold extended its weekly rally to $1,974.76 a troy ounce, its highest in a week. XAU/USD trades around $ 1,965, retaining gains amid broad risk aversion.
The market mood soured late on Tuesday, remaining subdued throughout Wednesday amid tepid Chinese data and uncertainty about the United States (US) debt ceiling bill. Furthermore, the US published the April JOLTS Job Openings report, which increased to 10.1 million, indicating the job market remains strong, despite the aggressive US Federal Reserve (Fed) stance. As an immediate result, market participants rushed to price in a 71% chance of a 25 basis points (bps) rate hike in the upcoming June monetary policy meeting.
The US Dollar soared against most major rivals as stock markets turned red. XAU/USD retreated from the aforementioned high amid resurgent demand for the Greenback, although due to Gold's safe-haven condition, it retains a good chunk of its intraday gains.
Meanwhile, the US debt-ceiling bill passed the House Rules Committee by a thin 7-6 margin and moved into Congress. Senate Majority Leader Chuck Schumer noted that he would bring it to the floor once it reaches the Senate as soon as possible.
XAU/USD price short-term technical outlook
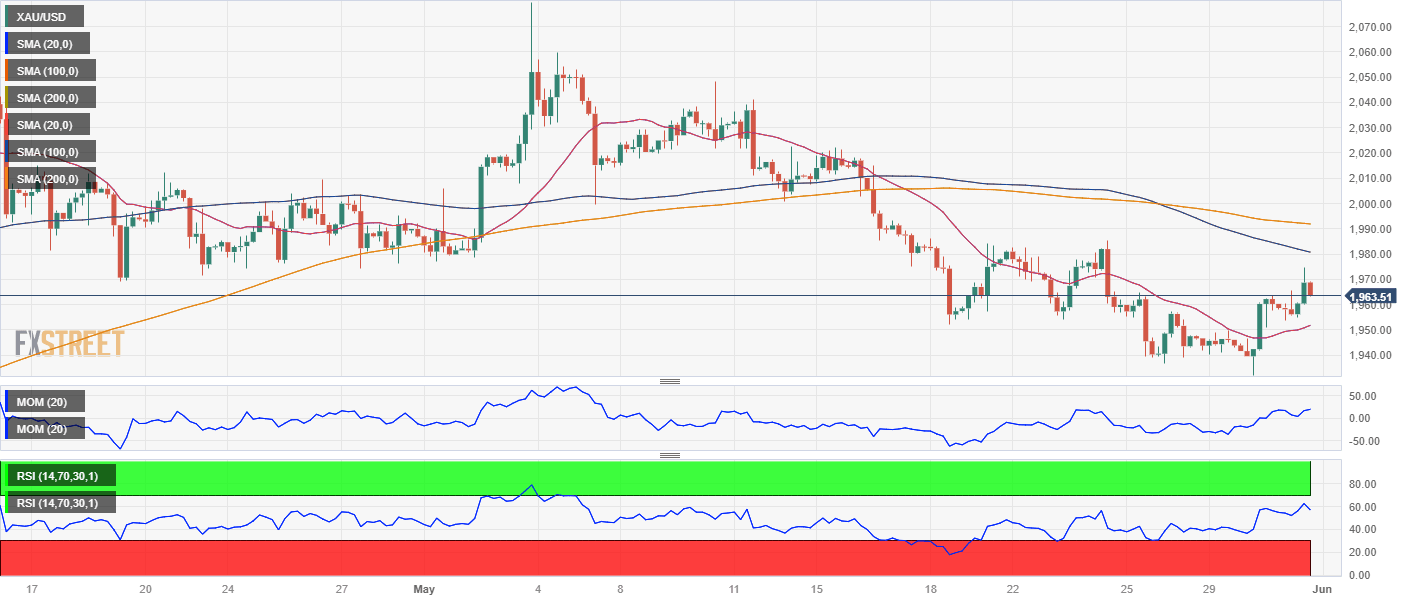
XAU/USD is up for a fourth consecutive day, but gains remain modest. The daily chart shows the pair trades mid-way between a flat 100 Simple Moving Average (SMA), providing support at around $1,937.35, and a bearish 20 SMA, currently at around $1,988. Technical indicators, in the meantime, remain within negative levels, grinding north with limited upward strength.
In the near term, and according to the 4-hour chart, the bullish potential remains limited. XAU/USD trades below bearish 100 and 200 SMAs, although the 20 SMA advances below the current level. Finally, technical indicators remain above their midlines but have turned south, reflecting the absence of sustained buying interest.
Support levels: 1,953.60 1,944.40 1,935.30
Resistance levels: 1,974.90 1,988.20 2,003.50
Premium
You have reached your limit of 3 free articles for this month.
Start your subscription and get access to all our original articles.
Author

Valeria Bednarik
FXStreet
Valeria Bednarik was born and lives in Buenos Aires, Argentina. Her passion for math and numbers pushed her into studying economics in her younger years.


