Gold Price Forecast: XAU/USD eases amid a better mood, retains the bullish stance

XAU/USD Current price: $1,977.19
- Government bond yields soared amid speculation of upcoming central banks’ decisions.
- Speculative interest keeps an eye on the Middle East conflict for market direction.
- XAU/USD retains its bullish potential despite easing demand for safety.
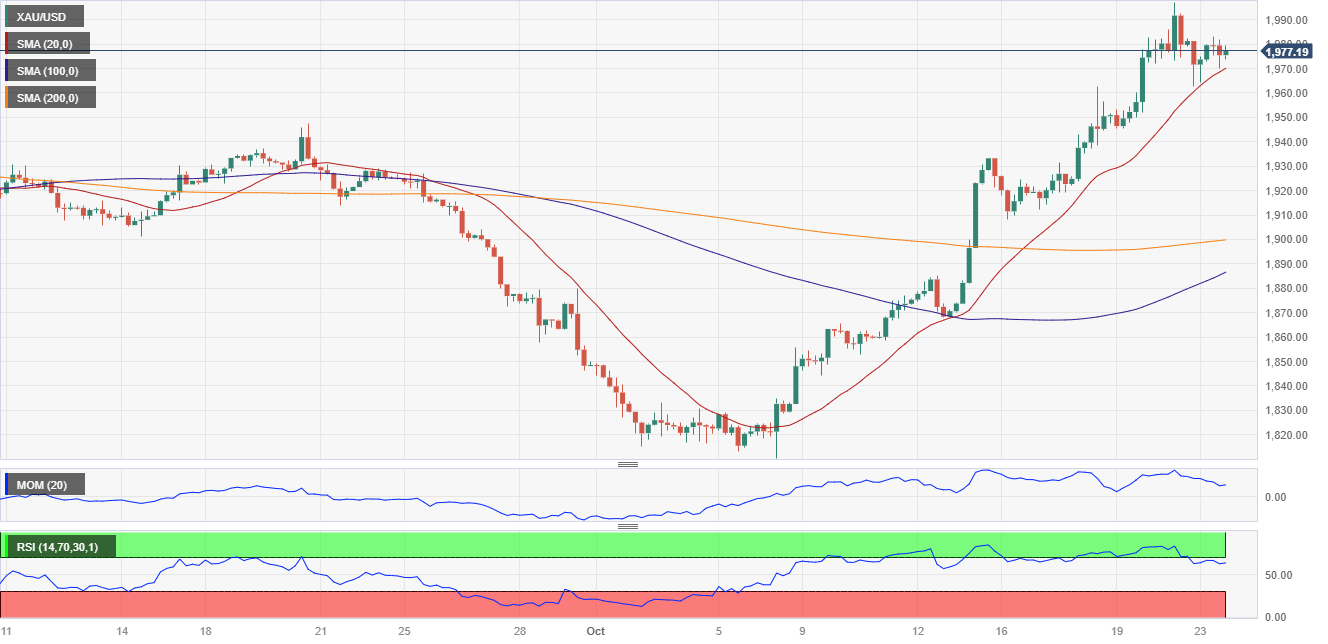
Spot Gold retreated from multi-month highs on Monday but met buyers on a dip to the $1,960 price zone. XAU/USD trades around $1,977 a troy ounce in the American session, trimming most of its pre-opening losses. Financial markets started the week with cautious optimism, as at least the Middle East conflict between Israel and Hamas did not escalate. Israel continues to delay a ground incursion into the Gaza Strip, hoping that Hamas will release more hostages.
Easing demand for safety weighed on the safe-haven metal and helped government bond yields to extend their rallies. The latter was also affected by speculation about monetary policies. On the one hand, Japanese government bond (JGB) yields rose to new multi-year highs as investors bet the Bank of Japan (BoJ) will adjust its yield curve control policy (YCC), when it meets next week. The 10-year JGB offered as much as 0.855%, its highest since July 2013. Meanwhile, the United States (US) 10-year Treasury note jumped to 5.02%, its highest since mid-2007, now down to 4.86%. The US Dollar remained on the back foot for most of the day, unaffected by the uptick in yields.
Meanwhile, speculative interest awaits first-tier events. The European Central Bank (ECB) will decide on monetary policy next Thursday, while the US will simultaneously release the first estimate of the Q3 Gross Domestic Product (GDP). On Friday, the US will release the September Personal Consumption Expenditures (PCE) Price Index, the Federal Reserve (Fed) 's favorite inflation gauge.
XAU/USD short-term technical outlook
The daily chart for XAU/USD shows it trades just below Friday’s closing level, with bulls still in control. Technical indicators consolidate within overbought readings, losing their former upward strength but giving no signs of upward exhaustion. At the same time, the pair develops above all its moving averages, with the 20 Simple Moving Average (SMA) gaining bullish strength far below the longer ones.
In the near term, and according to the 4-hour chart, XAU/USD is neutral to bullish. The 20 SMA heads north below the current level, leading the way higher by acting as a dynamic resistance. The longer moving averages, in the meantime, gain upward traction far below the shorter one. Finally, technical indicators have stabilized well above their midlines after correcting extreme overbought conditions, somehow suggesting limited selling interest.
Support levels: 1,964.30 1,954.45 1,936.60
Resistance levels: 1,982.80 1,997.30 2,008.10
Author

Valeria Bednarik
FXStreet
Valeria Bednarik was born and lives in Buenos Aires, Argentina. Her passion for math and numbers pushed her into studying economics in her younger years.

















