Gold Price Forecast: XAU/USD down on trade-deal hopes

XAU/USD Current price: $3,322.182
- Market players keep waiting for US-China headlines, hoping for the best.
- The May US Consumer Price Index is scheduled for release on Wednesday.
- XAU/USD retreats from around $3,350, could re-test the $3,300 mark.
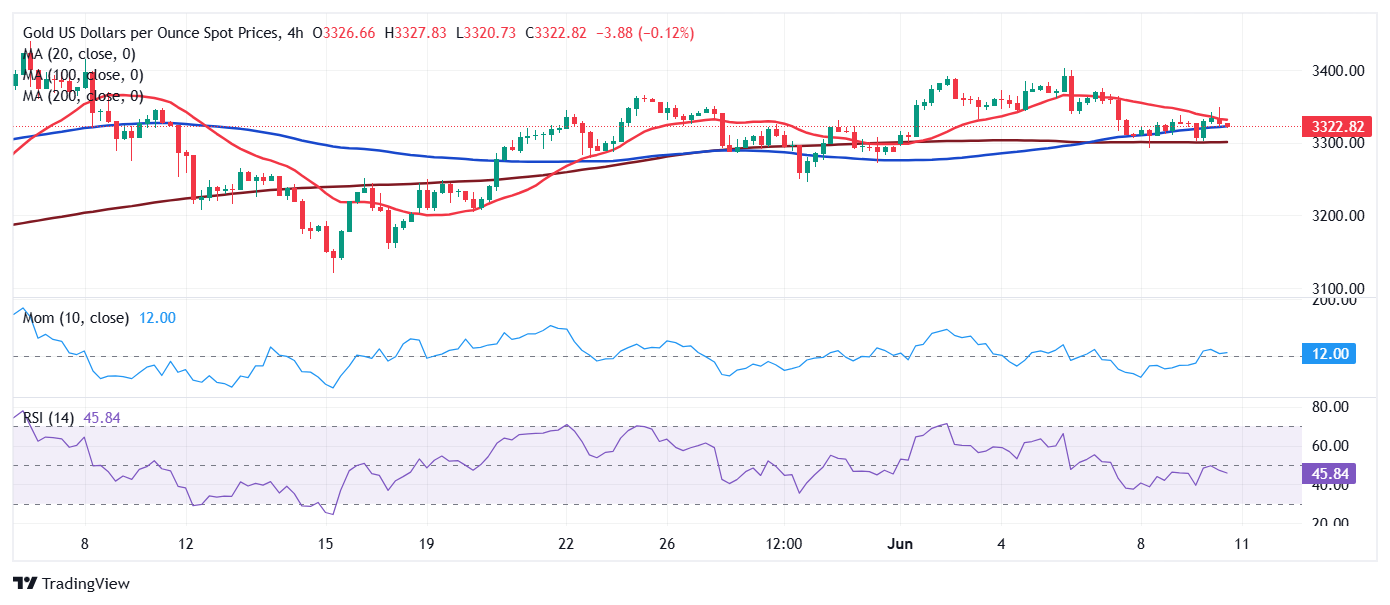
Spot Gold extended its weekly rally on Tuesday, approaching the $3,350 area in the American session. The US Dollar (USD) enjoyed near-term demand during Asian trading hours, and XAU/USD flirted with the $3,300 threshold at the beginning of the day as investors were optimistic about a potential trade deal between the United States (US) and China.
The absence of meaningful headlines and extended talks on Tuesday slowly weighed on the market’s mood, underpinning the bright metal. The USD, however, captured attention after Wall Street’s opening, once again advancing alongside stocks on hopes a trade deal will be announced shortly.
Indeed, easing tensions between Beijing and Washington would mean a firmer USD amid relief about US economic progress. On a positive note, the US reported progress on talks with other major economies, such as India. Still, the main theme remains on how the two world’s largest economy will resolve their conflict.
Coming ahead, investors are looking at the upcoming US Consumer Price Index (CPI) release. Inflation, as measured by the CPI, is expected to have posted a modest advance in May, maybe not enough to twist the Federal Reserve’s (Fed) monetary policy, but enough to fuel ongoing concerns about the US economic health.
XAU/USD short-term technical outlook
The daily chart for the XAU/USD pair shows the pair found buyers around a modestly bullish 20 Simple Moving Average (SMA) for a second consecutive day. The SMA provides support at around $3,302, while developing far above bullish 100 and 200 SMAs. The Momentum indicator eases and aims lower just above its 100 line, suggesting buying interest remains limited. Finally, the Relative Strength Index (RSI) indicator is flat at around 52, in line with the absence of directional strength. The bright metal would need to overcome the mentioned $3,350 region to turn bullish.
The near-term picture suggests XAU/USD could retest the $3,300 mark. The pair briefly surpassed a bearish 20 SMA, but was unable to retain ground above it. A flat 200 SMA at around $3,300, in the meantime, provided intraday support and reinforcing the round figure. Additionally, technical indicators aim modestly lower within negative levels, skewing the risk to the downside.
Support levels: 3,314.30 3,300.00 3,287.45
Resistance levels: 3,349.50 3,361.95 3,375.80
US-China Trade War FAQs
Generally speaking, a trade war is an economic conflict between two or more countries due to extreme protectionism on one end. It implies the creation of trade barriers, such as tariffs, which result in counter-barriers, escalating import costs, and hence the cost of living.
An economic conflict between the United States (US) and China began early in 2018, when President Donald Trump set trade barriers on China, claiming unfair commercial practices and intellectual property theft from the Asian giant. China took retaliatory action, imposing tariffs on multiple US goods, such as automobiles and soybeans. Tensions escalated until the two countries signed the US-China Phase One trade deal in January 2020. The agreement required structural reforms and other changes to China’s economic and trade regime and pretended to restore stability and trust between the two nations. However, the Coronavirus pandemic took the focus out of the conflict. Yet, it is worth mentioning that President Joe Biden, who took office after Trump, kept tariffs in place and even added some additional levies.
The return of Donald Trump to the White House as the 47th US President has sparked a fresh wave of tensions between the two countries. During the 2024 election campaign, Trump pledged to impose 60% tariffs on China once he returned to office, which he did on January 20, 2025. With Trump back, the US-China trade war is meant to resume where it was left, with tit-for-tat policies affecting the global economic landscape amid disruptions in global supply chains, resulting in a reduction in spending, particularly investment, and directly feeding into the Consumer Price Index inflation.
Author

Valeria Bednarik
FXStreet
Valeria Bednarik was born and lives in Buenos Aires, Argentina. Her passion for math and numbers pushed her into studying economics in her younger years.

















