Gold Price Forecast: XAU/USD could rebound if the $2,277 support holds
- Gold price consolidates the downside near $2,290 early Monday.
- The US Dollar holds firm alongside Treasury bond yields, following strong US Nonfarm Payrolls data.
- Gold price downside appears more compelling amid a bearish daily RSI. Any rebound could be temporary.

Gold price is languishing near four-week lows of $2,286 in Asian trades on Monday, looking to attempt a tepid rebound. The US Dollar holds higher ground alongside the US Treasury bond yields, extending Friday’s sharp gains after the robust US Nonfarm Payrolls (NFP) report.
Gold price looks to Fed verdict for further impetus
The US Labor Department's closely watched employment report showed on Friday that Nonfarm Payrolls increased by 272,000 jobs last month, against a job gain of 185K predicted while the Unemployment Rate unexpectedly rose to 4% in May from 3.9% in April. Average Hourly Earnings, a measure of wage inflation, rose 4.1% in the same period when compared to the 4% increase in April. Market expectations were for a 3.9% growth.
A strong US NFP headline print and the wage inflation data drove the US Treasury bond yields sharply higher across the curve, with the 2-year Treasury yields, which is sensitive to Fed policy expectations, shooting up by the most in two months. The US Dollar followed the upsurge in the US Treasury bond yields on a significant decline in the bets for a US Federal Reserve (Fed) interest rate cut in September, weighing heavily on the non-interest-bearing Gold price.
Markets dialed down bets of a 25 basis points (bps) rate cut in September to about 43% from about 55% before the report, according to the CME Group’s FedWatch Tool, and now see roughly an even chance of two rate cuts by the end of 2024, versus about a 68% chance seen before the NFP release, per Reuters.
The US Dollar upside gains renewed traction early Monday, as markets ramp up their bets on delayed Fed rate cuts heading into the US Consumer Price Index (CPI) data and the Fed policy announcements due on Wednesday.
Further, traders also digest mounting political tension in the Euro area, especially after French President Emmanuel Macron announced snap elections on Sunday, dissolving parliament after exit polls showed his alliance suffered a heavy defeat in European elections to Marine Le Pen’s far-right National Rally (RN) party.
The French political uncertainty could continue to exert downside pressure on the EUR/USD pair, adding extra legs to the US Dollar at the expense of the Gold price.
Meanwhile, in the absence of top-tier US economic data on Monday, all eyes will remain on risk sentiment and the US Dollar dynamics for fresh trading impetus on Gold price.
Gold price technical analysis: Daily chart
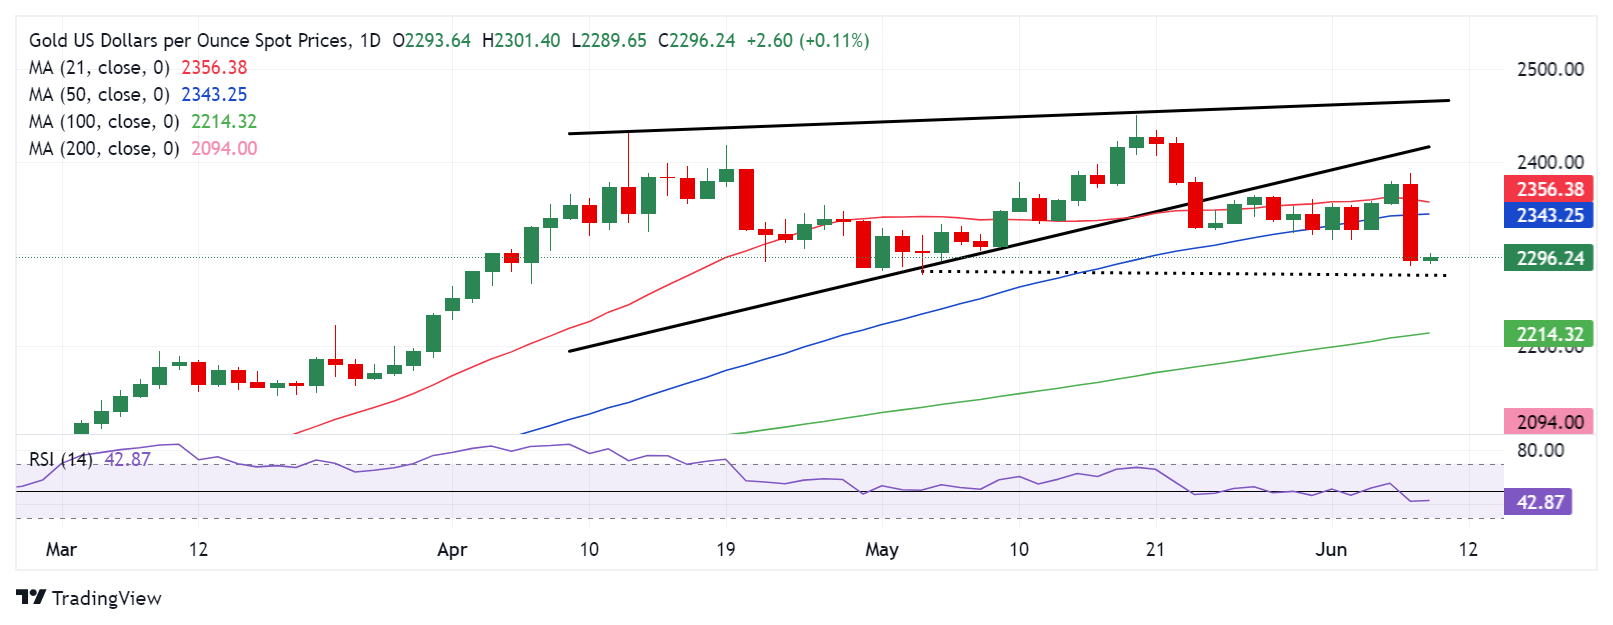
As observed on the daily chart, the Gold price extended the downside break of the rising wedge on Friday, following a brief period of consolidation.
In doing so, Gold price cracked below the key short-term daily Simple Moving Averages (SMA) to trade below the $2,300 mark.
At the moment, the 14-day Relative Strength Index (RSI) has stalled its descent but remains below the 50 level, near 43, keeping the door ajar for further downside.
The immediate demand area is seen at the May 3 low of $2,277. A sustained break of the latter could trigger a fresh sell-off toward the 100-day SMA at $2,214.
Ahead of that level, the $2,250 psychological barrier could be tested.
Alternatively, any recovery in Gold price will need acceptance above the 50-day SMA support-turned-resistance at $2,343.
Further up, recapturing the 21-day SMA at $2,357 will be critical to negating the near-term bearish bias.
Gold buyers will then flex their muscles toward the May 24 high of $2,364.
Gold FAQs
Gold has played a key role in human’s history as it has been widely used as a store of value and medium of exchange. Currently, apart from its shine and usage for jewelry, the precious metal is widely seen as a safe-haven asset, meaning that it is considered a good investment during turbulent times. Gold is also widely seen as a hedge against inflation and against depreciating currencies as it doesn’t rely on any specific issuer or government.
Central banks are the biggest Gold holders. In their aim to support their currencies in turbulent times, central banks tend to diversify their reserves and buy Gold to improve the perceived strength of the economy and the currency. High Gold reserves can be a source of trust for a country’s solvency. Central banks added 1,136 tonnes of Gold worth around $70 billion to their reserves in 2022, according to data from the World Gold Council. This is the highest yearly purchase since records began. Central banks from emerging economies such as China, India and Turkey are quickly increasing their Gold reserves.
Gold has an inverse correlation with the US Dollar and US Treasuries, which are both major reserve and safe-haven assets. When the Dollar depreciates, Gold tends to rise, enabling investors and central banks to diversify their assets in turbulent times. Gold is also inversely correlated with risk assets. A rally in the stock market tends to weaken Gold price, while sell-offs in riskier markets tend to favor the precious metal.
The price can move due to a wide range of factors. Geopolitical instability or fears of a deep recession can quickly make Gold price escalate due to its safe-haven status. As a yield-less asset, Gold tends to rise with lower interest rates, while higher cost of money usually weighs down on the yellow metal. Still, most moves depend on how the US Dollar (USD) behaves as the asset is priced in dollars (XAU/USD). A strong Dollar tends to keep the price of Gold controlled, whereas a weaker Dollar is likely to push Gold prices up.
Author

Dhwani Mehta
FXStreet
Residing in Mumbai (India), Dhwani is a Senior Analyst and Manager of the Asian session at FXStreet. She has over 10 years of experience in analyzing and covering the global financial markets, with specialization in Forex and commodities markets.


