Gold Price Forecast: XAU/USD corrective slide may be complete

XAU/USD Current price: $3,036.15
- The US Dollar surged amid risk aversion, extreme oversold conditions.
- The Bank of England kept the benchmark rate at 4.5%, as widely anticipated.
- XAU/USD could reach higher highs if the $3,020 area holds in the upcoming sessions.
Spot Gold retreated towards the $3,030 region after hitting yet another record high of $3,056.20 per troy ounce. The US Dollar (USD) strengthened during European trading hours as caution led ahead of American data and the Bank of England's (BoE) monetary policy decision.
On the one hand, the United States (US) published weekly unemployment data, showing claims increased by 223K in the last week, slightly better than the 224K expected. At the same time, the Philadelphia Fed Manufacturing Survey resulted at 12.5 in March, better than the 8.5 anticipated yet below the previous 18.1. Finally, Existing Home Sales were up 4.2% in February after falling by 4.7% in January. The data was mostly encouraging, helping the USD retain most of its intraday gains.
As for the BoE, the United Kingdom (UK) central bank maintained the benchmark interest rate on hold, as widely anticipated. Officials voted 8-1, availing the decision slightly more hawkish than the 7-2 anticipated. Additionally, policymakers showed concerns about the latest uptick in headline inflation, which was no surprise.
Demand for the USD eased after Wall Street’s opening, as US indexes posted an impressive comeback following a pre-opening slump. Stocks’ strength weighs on the USD, yet also prevents Gold from running north.
Friday will be light in terms of macroeconomic data, with investors looking at politics for direction.
XAU/USD short-term technical outlook
The daily chart for the XAU/USD pair shows it trades in the red, yet also that it posted a higher high and a higher low, keeping the dominant bullish trend alive. In the mentioned time frame, however, technical indicators are giving signs of upward exhaustion, losing strength at extreme levels, suggesting an upcoming corrective slide. At the same time, the bright metal holds above all bullish moving averages, with the 20 Simple Moving Average (SMA) providing dynamic support at around $2,941.70.
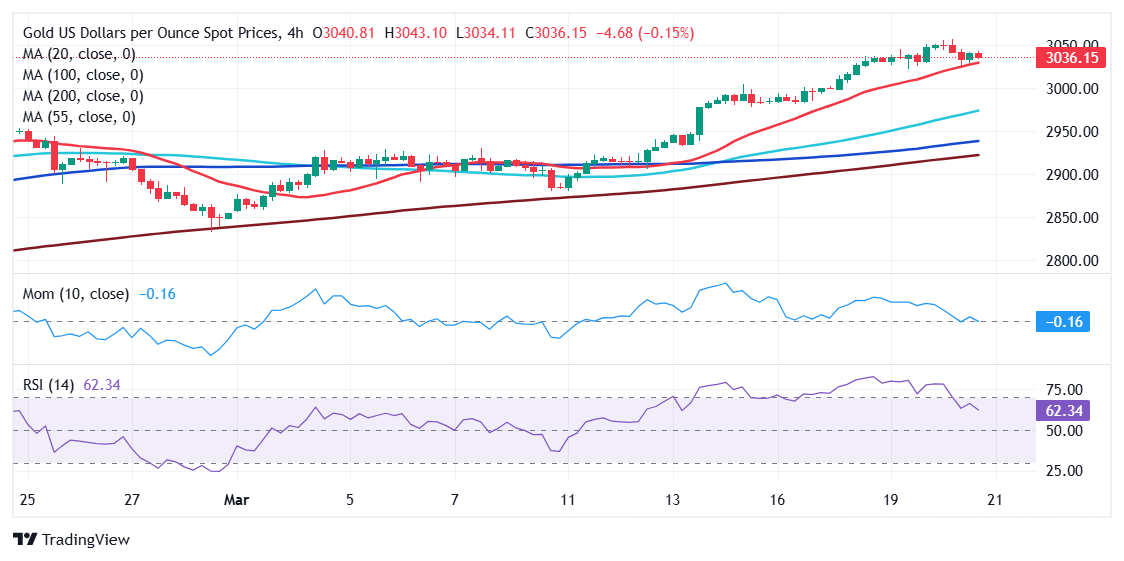
The 4-hour chart shows that the corrective decline may be complete as XAU/USD is bouncing from a firmly bullish 20 SMA, currently at $3,027.26, while the 100 and 200 SMAs keep heading higher, far below the shorter one. At the same time, the Momentum indicator aims lower within positive levels but loses downward strength, while the Relative Strength Index (RSI) indicator corrected overbought conditions before stabilizing at around 61.
Support levels: 3,027.20 3,011.00 2,996.90
Resistance levels: 3,056.30 3,070.00 3,085.00
US-China Trade War FAQs
Generally speaking, a trade war is an economic conflict between two or more countries due to extreme protectionism on one end. It implies the creation of trade barriers, such as tariffs, which result in counter-barriers, escalating import costs, and hence the cost of living.
An economic conflict between the United States (US) and China began early in 2018, when President Donald Trump set trade barriers on China, claiming unfair commercial practices and intellectual property theft from the Asian giant. China took retaliatory action, imposing tariffs on multiple US goods, such as automobiles and soybeans. Tensions escalated until the two countries signed the US-China Phase One trade deal in January 2020. The agreement required structural reforms and other changes to China’s economic and trade regime and pretended to restore stability and trust between the two nations. However, the Coronavirus pandemic took the focus out of the conflict. Yet, it is worth mentioning that President Joe Biden, who took office after Trump, kept tariffs in place and even added some additional levies.
The return of Donald Trump to the White House as the 47th US President has sparked a fresh wave of tensions between the two countries. During the 2024 election campaign, Trump pledged to impose 60% tariffs on China once he returned to office, which he did on January 20, 2025. With Trump back, the US-China trade war is meant to resume where it was left, with tit-for-tat policies affecting the global economic landscape amid disruptions in global supply chains, resulting in a reduction in spending, particularly investment, and directly feeding into the Consumer Price Index inflation.
Premium
You have reached your limit of 3 free articles for this month.
Start your subscription and get access to all our original articles.
Author

Valeria Bednarik
FXStreet
Valeria Bednarik was born and lives in Buenos Aires, Argentina. Her passion for math and numbers pushed her into studying economics in her younger years.


