|premium|

Gold Price Forecast: XAU/USD cheers dollar dumping, closes in on $2000

  • Gold bulls unstoppable, as the US dollar keeps falling.
  • Rallying Treasury yields fail to limit gold’s upside.
  • Eyes on US ISM Manufacturing PMI and Employment sub-index.

Gold (XAU/USD) hit the highest levels in two weeks near the $1990 mark, as the bulls remain unstoppable, courtesy of the relentless declines in the US dollar across its main competitors. The yieldless gold continues to benefit from expectations of a low-interest-rate environment for a prolonged period in the aftermath of the Fed Chair Powell’s speech. The yellow metal finally dived out of the eight-day-long range above the $1977 hurdle, as it looks to regain the $2000 threshold.

The bullish tone in gold is also backed by the weak performance in the Asian equities following a softer close on Wall Street overnight. The continued rise in the coronavirus cases globally overwhelm the markets. Looking ahead, only a better-than-expected US ISM Manufacturing PMI and Employment sub-index could come to the rescue of the dollar bulls,

Gold: Hourly chart

Short-term technical perspective  

fxsoriginal

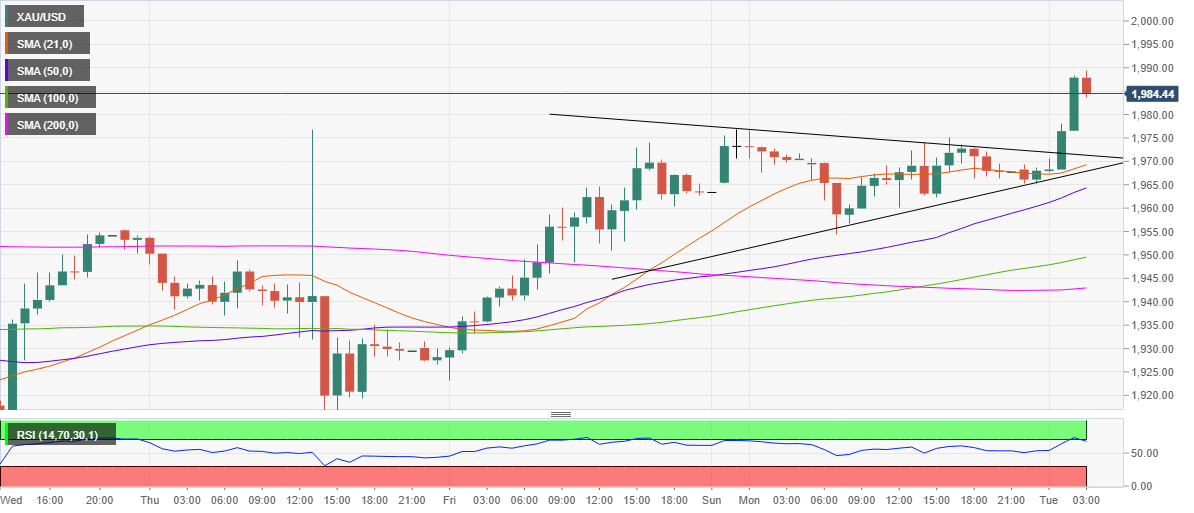
On the hourly chart, Gold has displayed a pennant breakout, having closed the hour above the falling trendline (pattern) resistance at $1972.

The bullish breakout triggered a sharp rally towards the $1990 mark, especially after the price pierced above the 21-hourly Simple Moving Average (SMA), then at $1967.50.

Gold now looks to test the pattern target at $1994 en route the critical hurdle at $2000.

The hourly Relative Strength Index (RSI) has reversed from the overbought territory, still remains bullish near the 68 area.

The pattern resistance now support at $1972 will act as the immediate support, below which the $1970 level could be challenged. That level is the confluence of the 21-HMA and the pattern support.

Should the selling pressure accelerate the upward-sloping 50-HMA at $1964 could come into play.

Gold: Additional levels to consider

XAU/USD

Overview
Today last price1986.20
Today Daily Change17.40
Today Daily Change %0.88
Today daily open1967.8
 
Trends
Daily SMA201969.33
Daily SMA501889
Daily SMA1001803.35
Daily SMA2001681.11
 
Levels
Previous Daily High1976.76
Previous Daily Low1954.37
Previous Weekly High1976.79
Previous Weekly Low1902.76
Previous Monthly High2075.32
Previous Monthly Low1863.24
Daily Fibonacci 38.2%1968.21
Daily Fibonacci 61.8%1962.92
Daily Pivot Point S11955.86
Daily Pivot Point S21943.92
Daily Pivot Point S31933.47
Daily Pivot Point R11978.25
Daily Pivot Point R21988.7
Daily Pivot Point R32000.64

Premium

You have reached your limit of 3 free articles for this month.

Start your subscription and get access to all our original articles.

Subscribe to PremiumSign In

Author

Dhwani Mehta

Dhwani Mehta

FXStreet

Residing in Mumbai (India), Dhwani is a Senior Analyst and Manager of the Asian session at FXStreet. She has over 10 years of experience in analyzing and covering the global financial markets, with specialization in Forex and commodities markets.

More from Dhwani Mehta
Share:

Editor's Picks

AUD/USD eyes 0.7150 barrier nine-day EMA

AUD/USD inches higher after registering modest losses in the previous day, trading around 0.7130 during the Asian hours. The technical analysis of the daily chart indicates that the pair is moving sideways within the rectangle pattern, suggesting a consolidation as neither the bulls nor the bears have enough momentum to take control of the market.

USD/JPY trades below 160.00 intervention threshold; bullish bias intact

The USD/JPY pair attracts some sellers during the Asian session amid fears that authorities will step in again to prop up the Japanese Yen. Furthermore, the Israel-Lebanon truce prompts some profit-taking around the US Dollar and exerts downward pressure on the currency pair.

Gold defends 200-day SMA at $4,425, but for how long?

Gold is attempting a tepid recovery toward $4,500 early Thursday, as renewed optimism in the Mideast geopolitical front calms market nerves. This cautious optimism across Asian markets weighs on Oil prices, and diminishes the US Dollar’s safe-haven appeal, helping Gold stage a decent comeback from the weekly low of $4,424.


Hyperliquid: ETF demand, capital rotation fuel HYPE rally as Bitcoin melts

Hyperliquid price sustains an upward trend near its all-time high of $75.76 on Thursday after posting 80% gains in May, while Bitcoin (BTC) retraces below $65,000, triggering a market-wide panic.

Kevin Warsh takes the Fed helm: What it means for the US Dollar
The Federal Reserve moves away from the highly predictable "forward guidance" model of the Jerome Powell era to a new “Kevin Warsh environment”, characterized by less communication, more policy surprises, and an increased focus on the Fed's complex balance sheet.
Recession on paper: What really moves the Canadian Loonie now?

Statistics Canada handed the headline writers a gift and the analysts a headache. Real GDP shrank 0.1% on an annualized basis in the first quarter, and with the fourth quarter of 2025 revised down to a 1.0% contraction, that is two negative quarters in a row, the textbook definition of a technical recession and Canada's first since the pandemic.