Gold Price Forecast: XAU/USD buyers recapture key $2,415 resistance, where next?
- Gold price looks to build on the previous rebound early Friday, eyes weekly gains.
- Risk flows return, and the US Treasury bond yields pullback, weighing on the US dollar.
- Unexpectedly upbeat US Jobless Claims data alleviate recessionary fears.
- Gold price averts a symmetrical triangle breakdown and regain 21-day SMA, as the daily RSI turns bullish.

Gold price is consolidating at the weekly high near $2,410, gathering pace to extend the previous rebound. Gold price remains on track to settle the week in the green, staging a sold recovery from the recent correction from two-week highs.
Gold price awaits fresh catalysts for the next push higher
Markets saw an impressive upswing in Gold price on Thursday even as the US Dollar (USD) rebounded firmly in tandem with the Wall Street indices, following the release of the surprisingly strong US weekly Jobless Claims data.
Initial claims for state unemployment benefits fell 17,000 to a seasonally adjusted 233,000 for the week ended August 3, the Labor Department said on Thursday, August 8, the largest drop in about 11 months, suggesting the gradual softening in the labor market remains intact while calming markets nerves over a potential US recession.
The uptick in the Gold price could be attributed to restoring investors’ faith across the financial markets after Monday’s turmoil prompted traders to lock in gains in their Gold longs to cover losses elsewhere.
Meanwhile, conciliatory comments from Richmond Fed President Thomas Barkin and Chicago Fed President Austan Goolsbee also added to the market optimism. However, dovish remarks from Kansas City Fed Chief Jeffrey Schmid spoilt the US Dollar’s party, as the US Treasury bond yields pulled back sharply from the weekly top.
Further, the risk-on market environment also dulled the Greenback’s appeal as a safe-haven asset, helping Gold price settle at the highest level seen so far this week at $2,428.
Additionally, Gold price witnessed chart-based buying after buyers managed to defend a critical support area on the daily timeframe.
In Friday’s trading so far, the buoyant tone in the Asian stock markets keeps the US Dollar on the back foot but Gold buyers seem to have turned cautious heading into the weekly close. The end-of-the-week flows will likely remain in play while traders could also reposition themselves before next week’s crucial US Consumer Price Index (CPI) data.
The absence of any top-tier US economic data on Friday, put the focus back on risk trends and Middle East geopolitical tensions, as Iran considers to pull back in exchange for progress on Gaza peace talks.
This comes after US President Joe Biden and the leaders of Egypt and Qatar said Thursday that they were prepared to present a “final” cease-fire proposal to end the war in Gaza and called on Israel and Hamas to return to the negotiating table next week to settle the conflict.
Gold price technical analysis: Daily chart
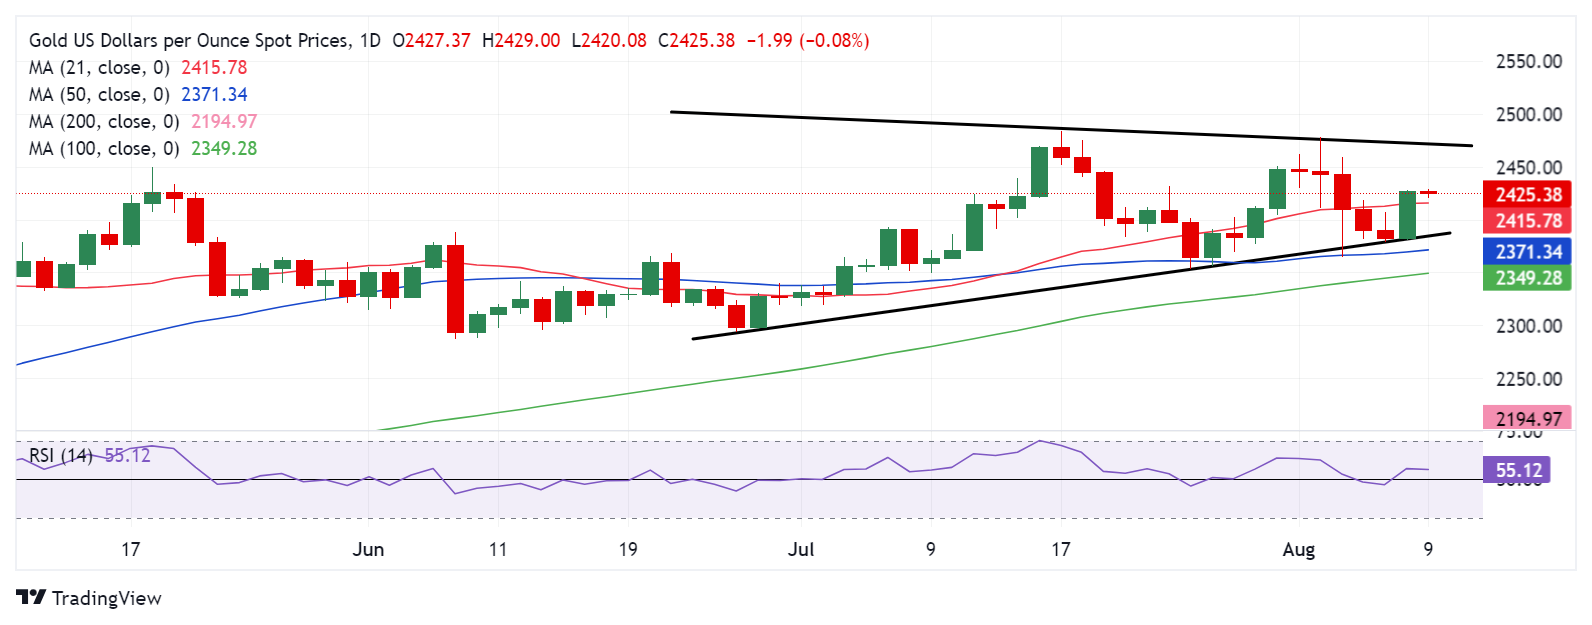
As observed on the daily chart, Gold price remains within a symmetrical triangle formation, having failed to seek a downside break after defending the key rising trendline support at $2,380.
The key leading indicator, the 14-day Relative Strength Index (RSI), has returned to positive territory, currently near 55.00, suggesting that upside risks remain in place for an extended Gold price rebound.
Adding credence to the bullish potential, Gold buyers recaptured the 21-day Simple Moving Average (SMA) support-turned-resistance at $2,415 on a daily closing basis.
The immediate upside barrier is seen at the August 5 high of $2,459, above which the falling trendline resistance at $2,470 and the two-week high of $2,478 will be challenged.
Conversely, should Gold sellers fight back control, the immediate support is aligned the 21-day SMA at $2,415.
If the downside sustains, the abovementioned rising trendline support at $2,380 will come into play once again.
Thereafter, the 50-day SMA at $2,371 could come to the immediate rescue of Gold buyers.
Gold FAQs
Gold has played a key role in human’s history as it has been widely used as a store of value and medium of exchange. Currently, apart from its shine and usage for jewelry, the precious metal is widely seen as a safe-haven asset, meaning that it is considered a good investment during turbulent times. Gold is also widely seen as a hedge against inflation and against depreciating currencies as it doesn’t rely on any specific issuer or government.
Central banks are the biggest Gold holders. In their aim to support their currencies in turbulent times, central banks tend to diversify their reserves and buy Gold to improve the perceived strength of the economy and the currency. High Gold reserves can be a source of trust for a country’s solvency. Central banks added 1,136 tonnes of Gold worth around $70 billion to their reserves in 2022, according to data from the World Gold Council. This is the highest yearly purchase since records began. Central banks from emerging economies such as China, India and Turkey are quickly increasing their Gold reserves.
Gold has an inverse correlation with the US Dollar and US Treasuries, which are both major reserve and safe-haven assets. When the Dollar depreciates, Gold tends to rise, enabling investors and central banks to diversify their assets in turbulent times. Gold is also inversely correlated with risk assets. A rally in the stock market tends to weaken Gold price, while sell-offs in riskier markets tend to favor the precious metal.
The price can move due to a wide range of factors. Geopolitical instability or fears of a deep recession can quickly make Gold price escalate due to its safe-haven status. As a yield-less asset, Gold tends to rise with lower interest rates, while higher cost of money usually weighs down on the yellow metal. Still, most moves depend on how the US Dollar (USD) behaves as the asset is priced in dollars (XAU/USD). A strong Dollar tends to keep the price of Gold controlled, whereas a weaker Dollar is likely to push Gold prices up.
Premium
You have reached your limit of 3 free articles for this month.
Start your subscription and get access to all our original articles.
Author

Dhwani Mehta
FXStreet
Residing in Mumbai (India), Dhwani is a Senior Analyst and Manager of the Asian session at FXStreet. She has over 10 years of experience in analyzing and covering the global financial markets, with specialization in Forex and commodities markets.


