Gold Price Forecast: XAU/USD bulls fight for control amid a potential bearish wedge
- Gold price rebounds as the US Dollar turns south after China’s GDP beats estimates.
- Markets seek fresh Federal Reserve rate hike cues for a fresh directional trade.
- 21-Daily Moving Average guards the downside for Gold price within a potential bearish wedge.

Gold price is finding its feet near the $2,000 mark, snapping a two-day corrective decline, as the United States Dollar (USD) retreats early Tuesday despite the mixed market sentiment.
Mixed United States Consumer-centric data and Fedspeak revive the US Dollar
The US Dollar has paused its two-day recovery mode and returned to the red on Tuesday, as strong US banks’ earnings reports and upbeat Chinese Gross Domestic Product (GDP) data calmed markets. China's economic recovery gathered pace in the first quarter after the country’s GDP grew 4.5% year-on-year in the first three months of the year, beating expectations for a 4% expansion.
However, the further retreat in the US Dollar depends on the US Federal Reserve (Fed) rate hike expectations. Markets priced in a 91% chance of the Fed raising interest rates by 25 basis points (bps) at its next meeting in May. That increase came after past US retail sales figures were revised upwards, a Fed official said rate hikes were yet to have the desired effect and consumer inflation expectations rose on Friday. At the time of writing, the market pricing for a 25 bps May Fed rate hike stands at 87%.
All eyes will be on the comments from Fed officials and Friday’s S&P Global Preliminary PMIs from the United States for Fed rate hike prospects, which will have a significant bearing on the US Dollar valuations, as well as, on the USD-denominated Gold price.
Meanwhile, the US Treasury bond yields also stall the recent advance, as investors await a strong catalyst for fresh trading impetus. The benchmark 10-year US Treasury bond yields are holding up well above the key 3.50% level.
From the United States economic docket, the Housing Starts and Building Permits could be eyed ahead of a speech from Federal Reserve Governor Michelle Bowman.
Gold price technical analysis: Daily chart
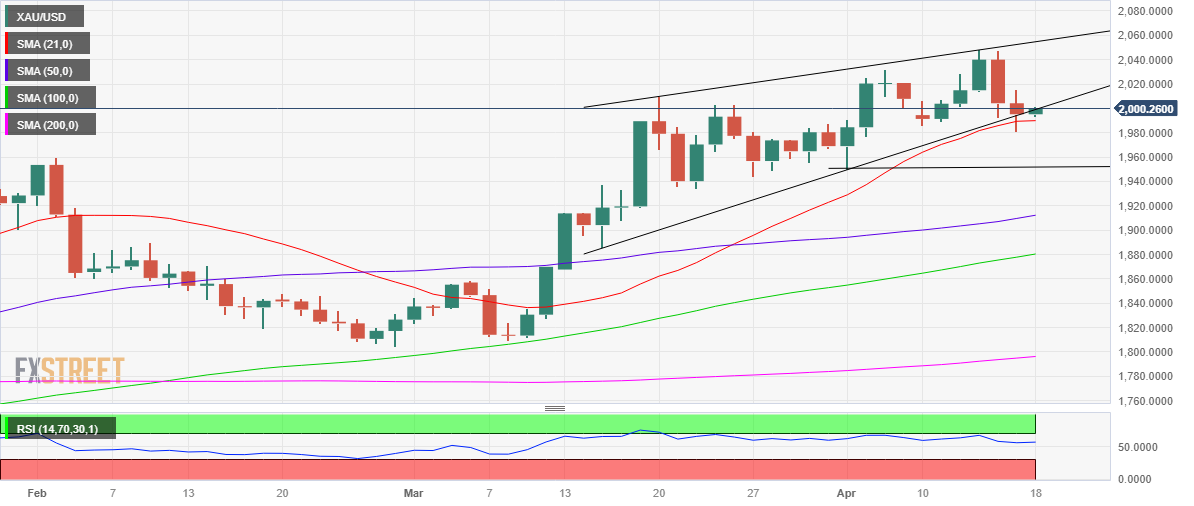
As observed on the daily chart, Gold price opened Tuesday below the rising wedge support at $1,999.
Daily candlestick close below the latter will confirm a downside break from a month-long rising wedge pattern.
In such a case, the bullish 21-Daily Moving Average (DMA) at $1,990 will be of little help to the Gold buyers.
A fresh downswing will be initiated below the 21 DMA support, exposing the key psychological cap and April 3 low at $1,950.
With the 14-day Relative Strength Index (RSI), however, still holding above the midline, Gold bulls are still hopeful of a renenwed uptrend.
If bulls manage to defend the 21 DMA support once again, then Gold price could rebound toward the previous day’s high of $2,015.
The next upside target is seen at the round figure of $2,020. Further, the previous yearly high at $2,032 will challenge the bearish commitments.
Premium
You have reached your limit of 3 free articles for this month.
Start your subscription and get access to all our original articles.
Author

Dhwani Mehta
FXStreet
Residing in Mumbai (India), Dhwani is a Senior Analyst and Manager of the Asian session at FXStreet. She has over 10 years of experience in analyzing and covering the global financial markets, with specialization in Forex and commodities markets.


