• Gold bulls stay in control with eyes on a deeper correction for the week ahead.
  • A 61.8% golden ratio on the daily chart beckons.

Gold ended the day on Friday in positive territory having swept a key area on the daily chart that was highlighted as a target zone in last week's pre-open analysis. The moves came on the back of the US dollar peaking mid-week. However, analysts at TD Securities argued that the yellow metal remains overvalued relative to real rate. ''Other reportables continue to hold onto their complacent length, we think risks of a breakout lower in gold prices are rising.''

Nevertheless, technically, there is still a case for a deeper correction, especially should the US dollar continue to reverse course:
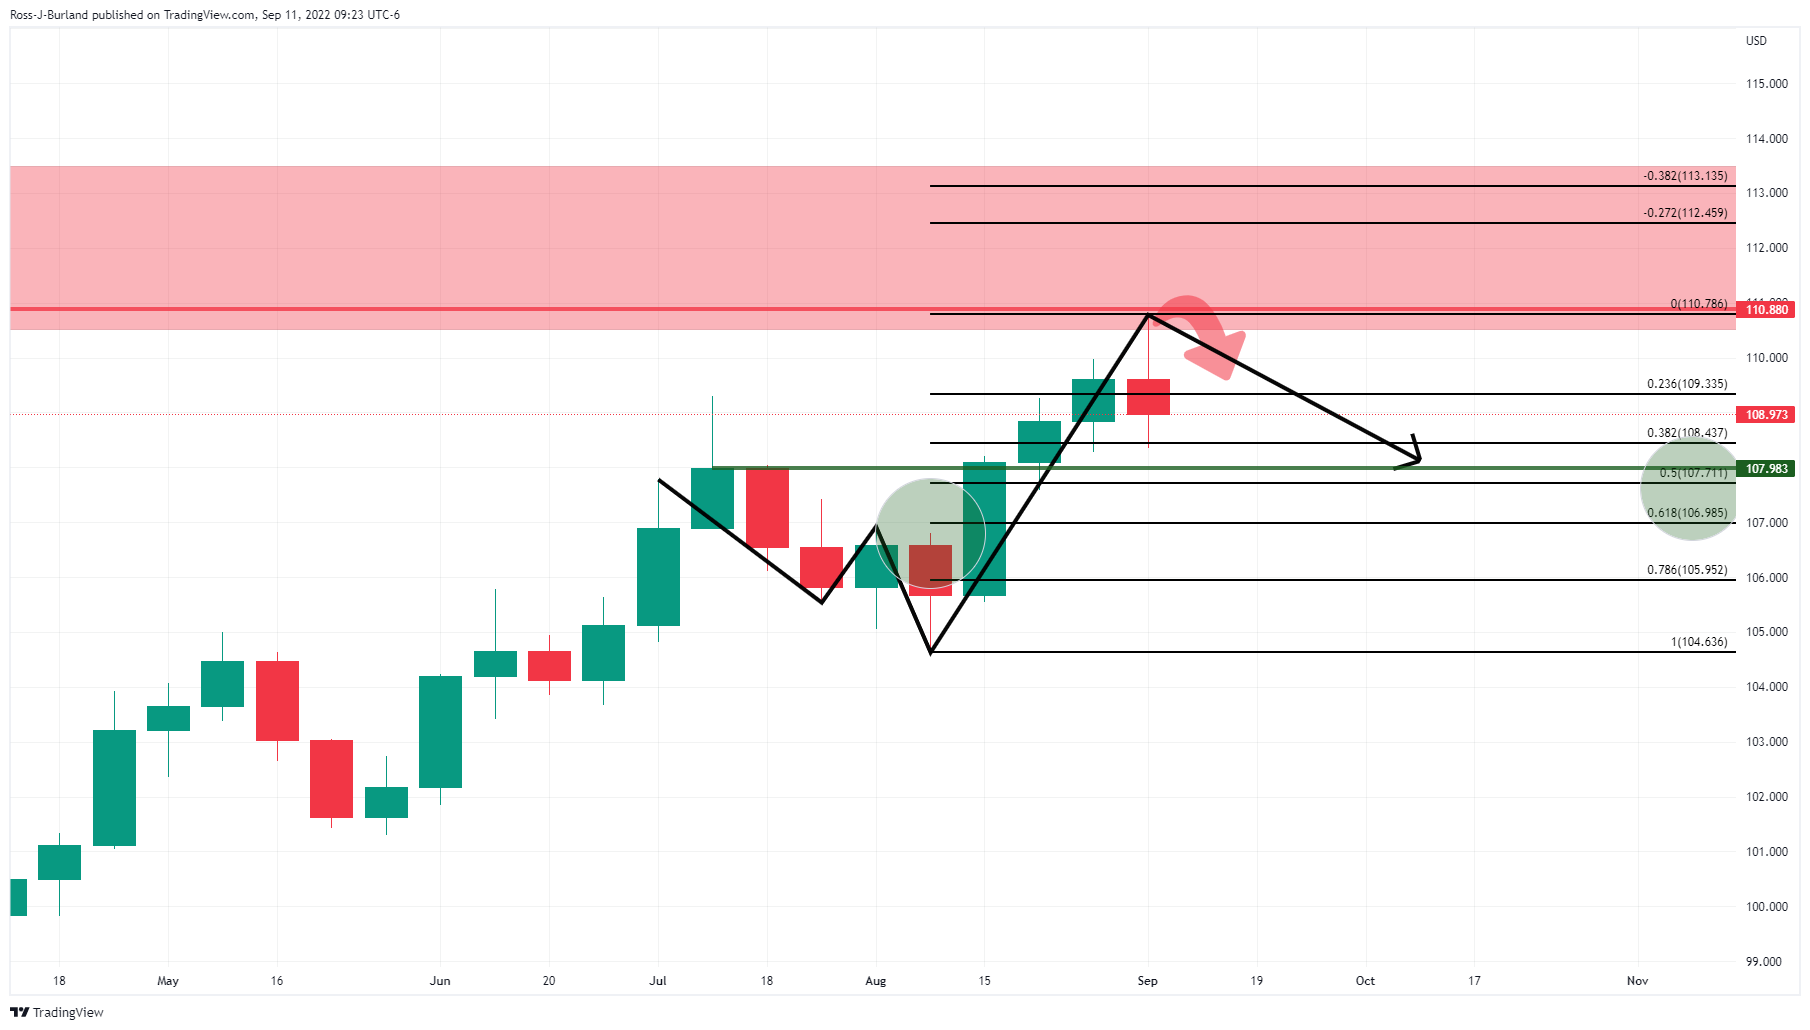
(DXY weekly chart)

The DXY, an index that measures the US dollar vs. a basket of currencies, has been called at a prior weekly structure near 110.80 and has subsequently started to revert towards the prior closing highs of mid-July in what would be a 50% mean reversion. Thereafter, there is room to the neckline of the W-formation in a 61.8% Fibonacci retracement around 107 the figure. In such a scenario, this would likely support the yellow metal and the following illustrates the bullish thesis on the charts:

Gold, prior analysis

In last week's pre-open analysis, it was explained that the price had corrected from a strong sell-off on the daily timeframe. The bulls were moving in on a 38.2% Fibonacci retracement with prospects for a deeper correction as illustrated on the chart below:


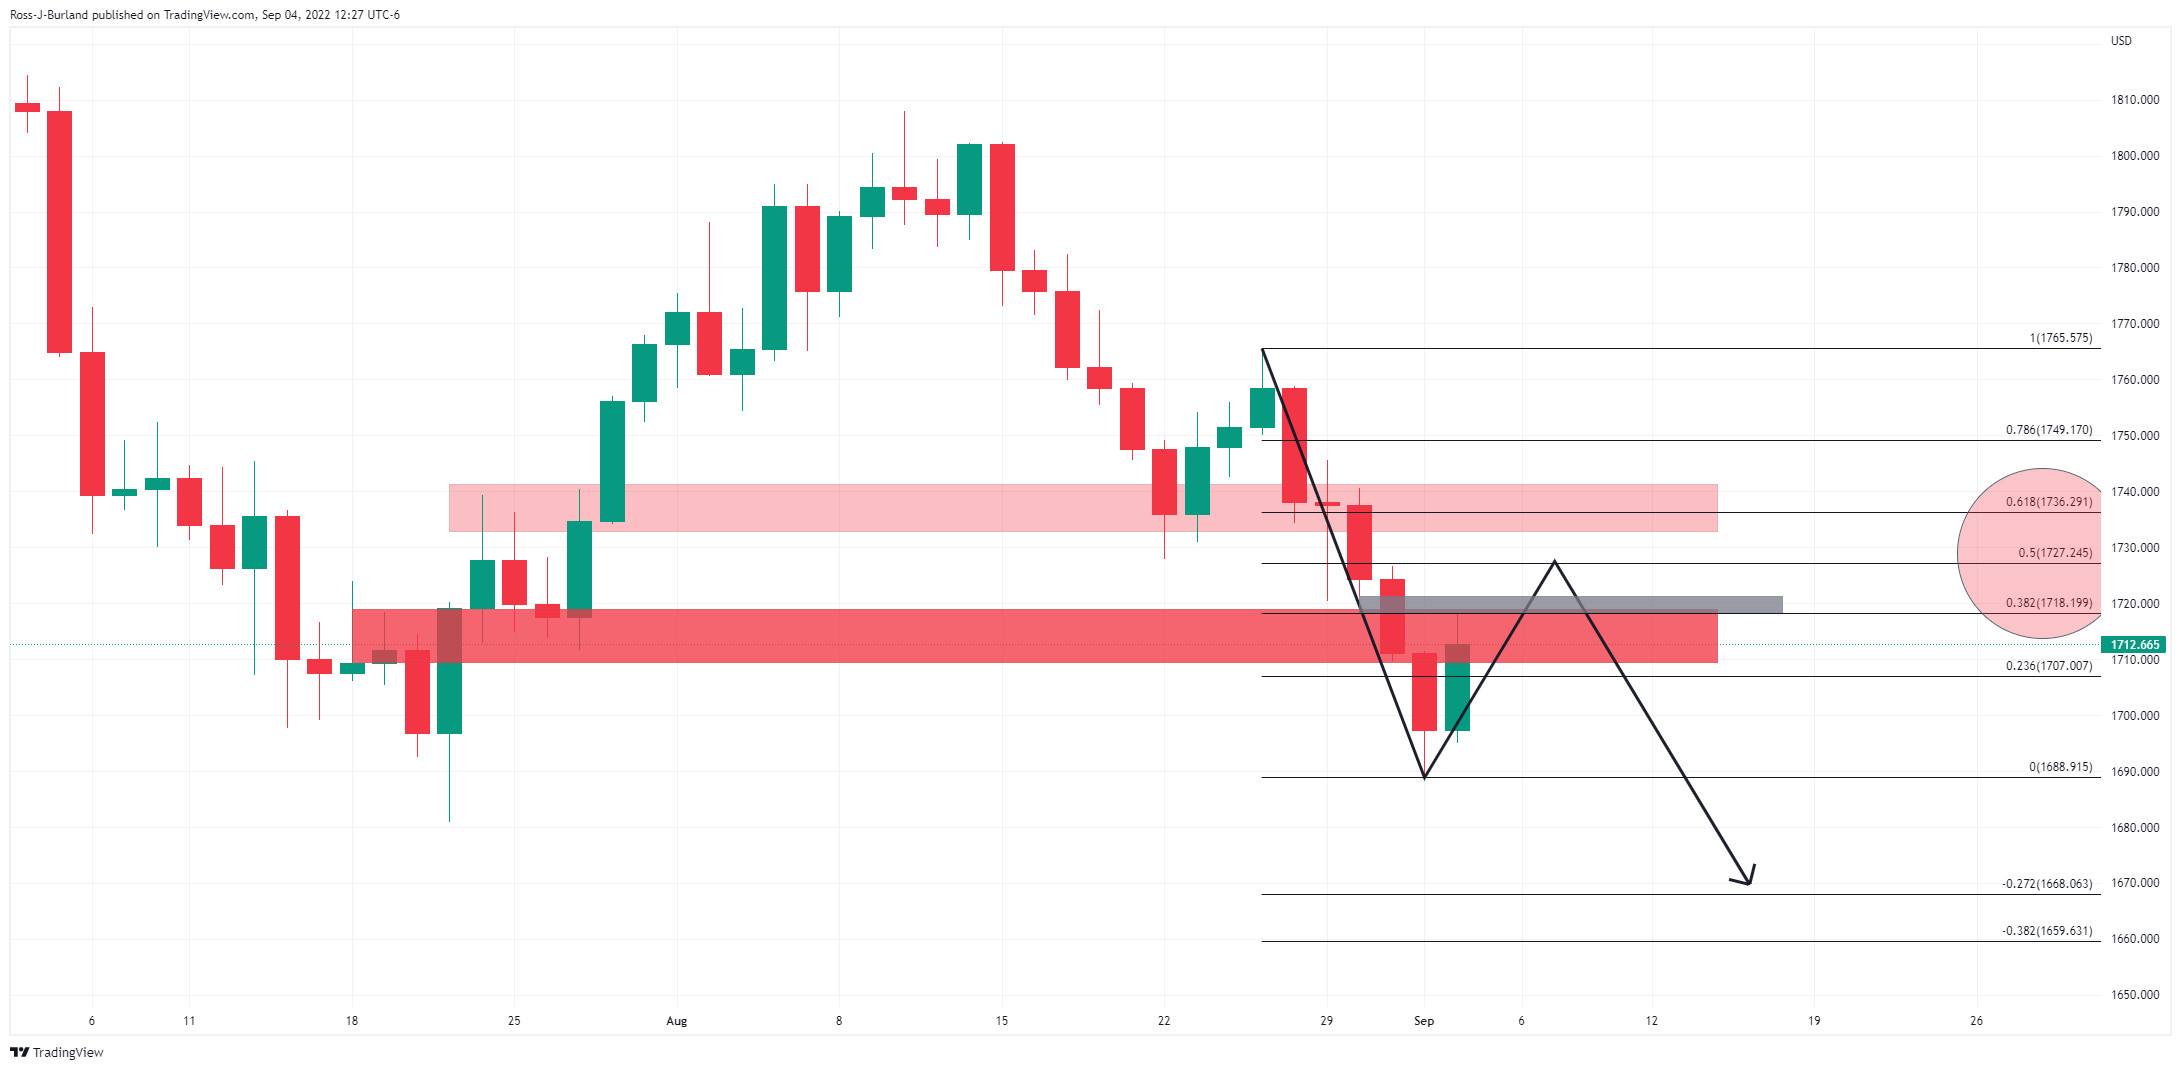
The price was headed towards a price imbalance near $1,721 and beyond there, a 50% mean reversion comes in near $1,727 prior structure. If bears gave ground to the bulls, then the last defence was eyed as being a touch higher around $1,736 as a 61.8% Fibonacci retracement.

Gold live market, daily and H4 charts

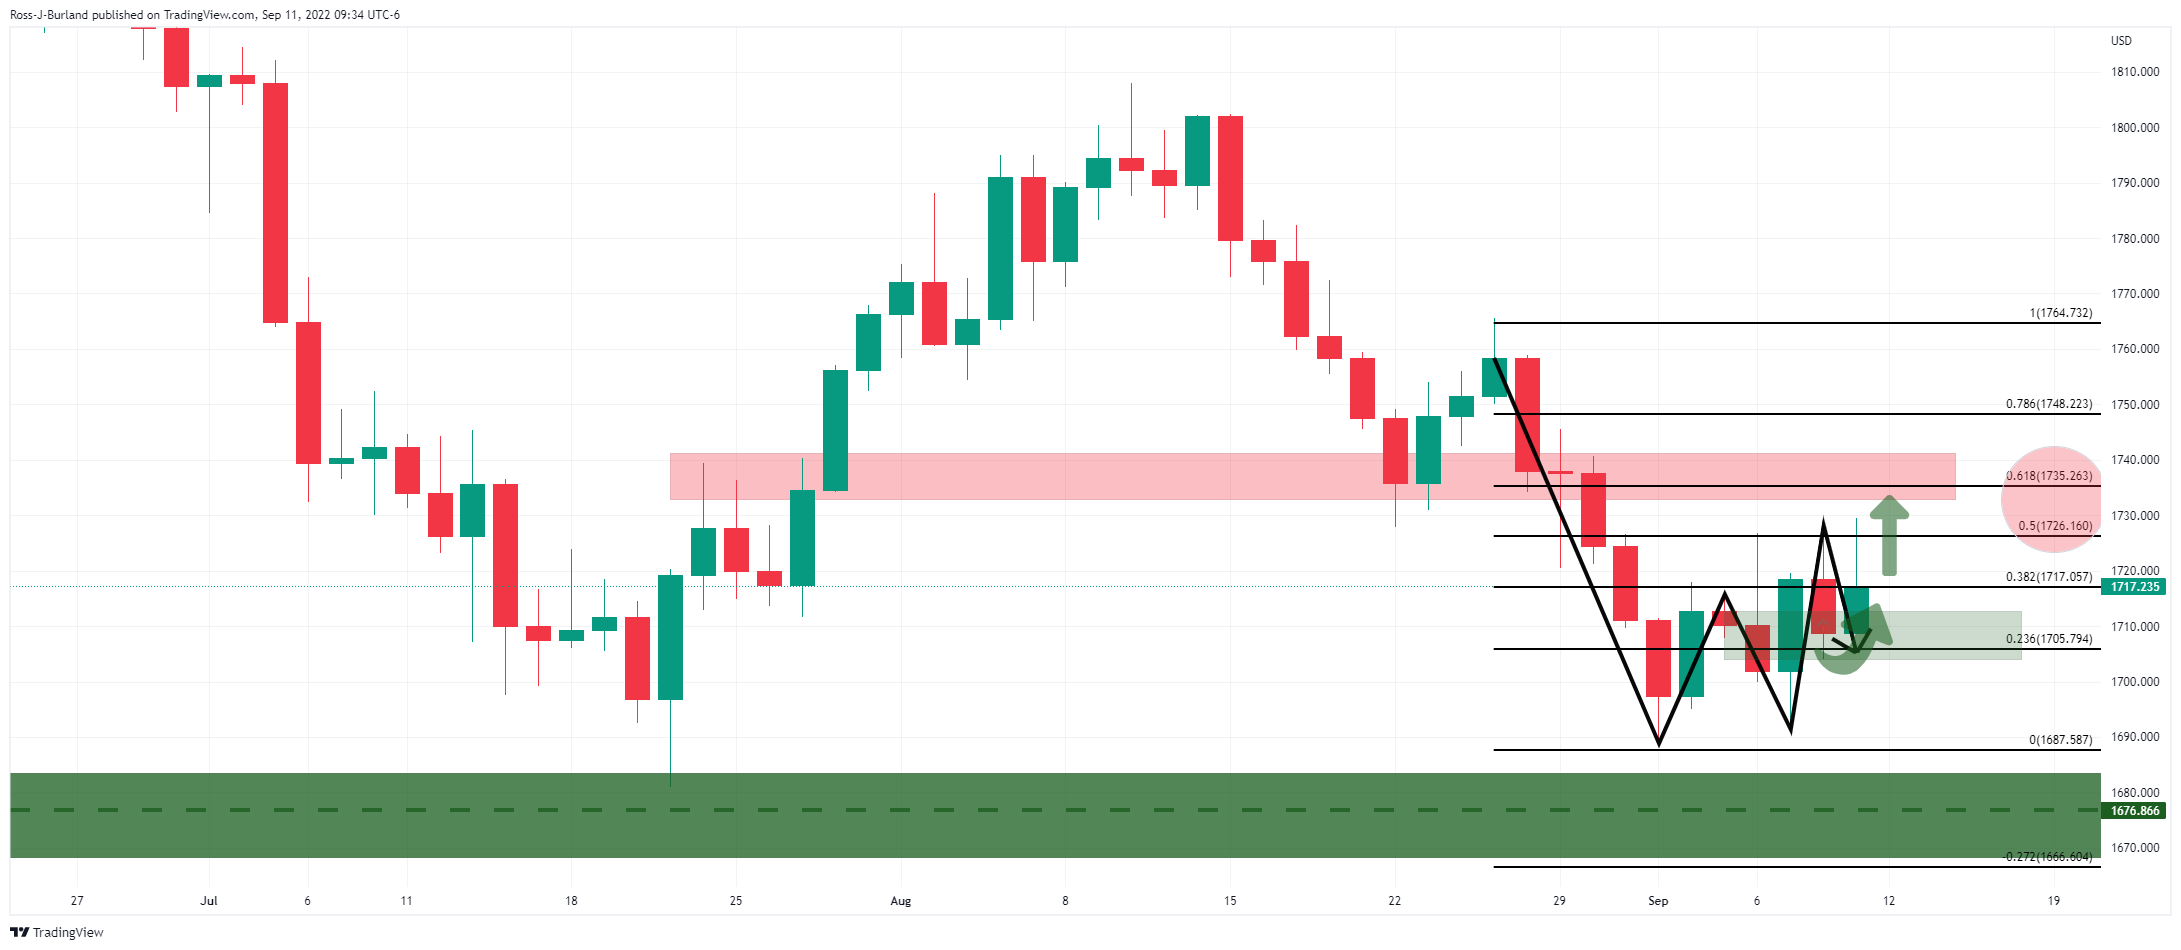
The daily chart has seen the price sweep up the price imbalance around $1,721 and the 50% mean reversion near $1,727 prior structure with a high of $1,729 made so far. A W-formation's neckline has acted as support which leaves prospects for a move higher for the week ahead


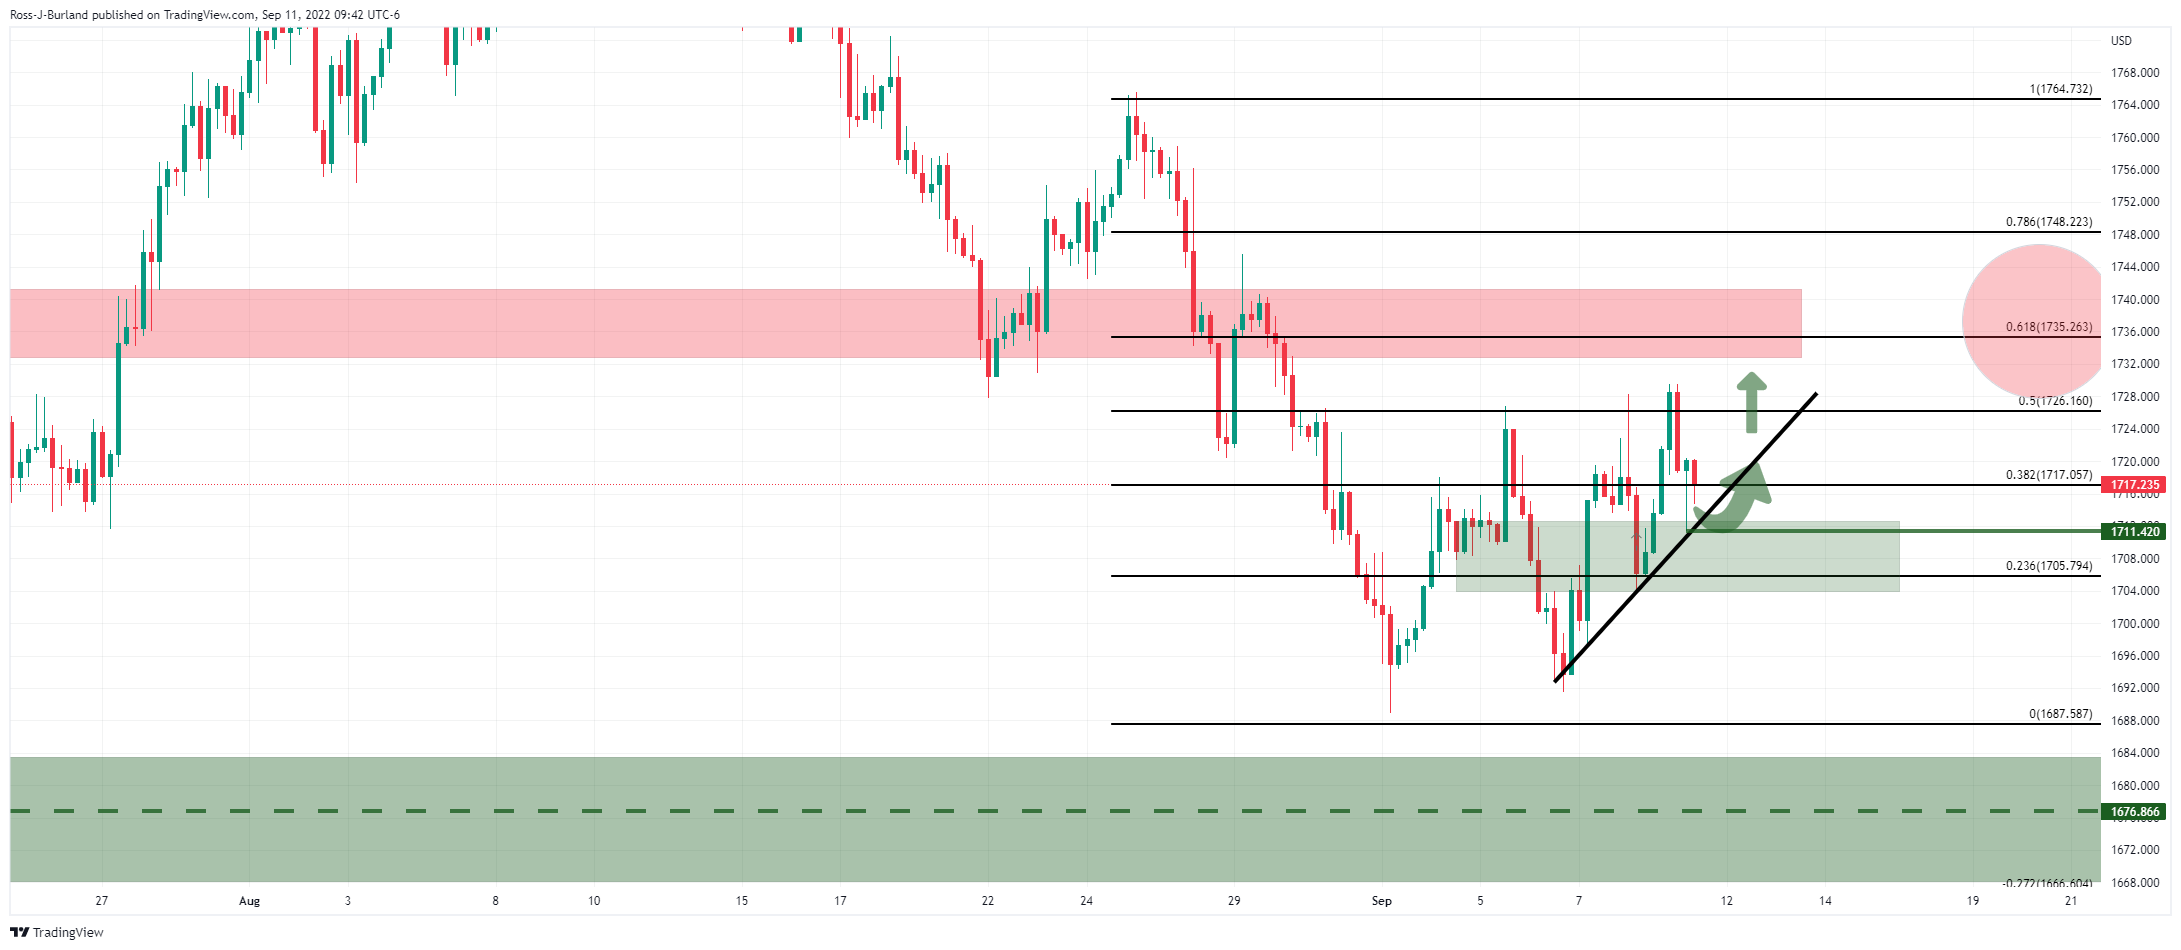
The 4-hour chart's recent low of $1,711 could be important for the opening sessions. So long as bulls can hold on above there, then the structure will remain bullish and favour a move higher towards $1,735 resistance on a break of $1,720.

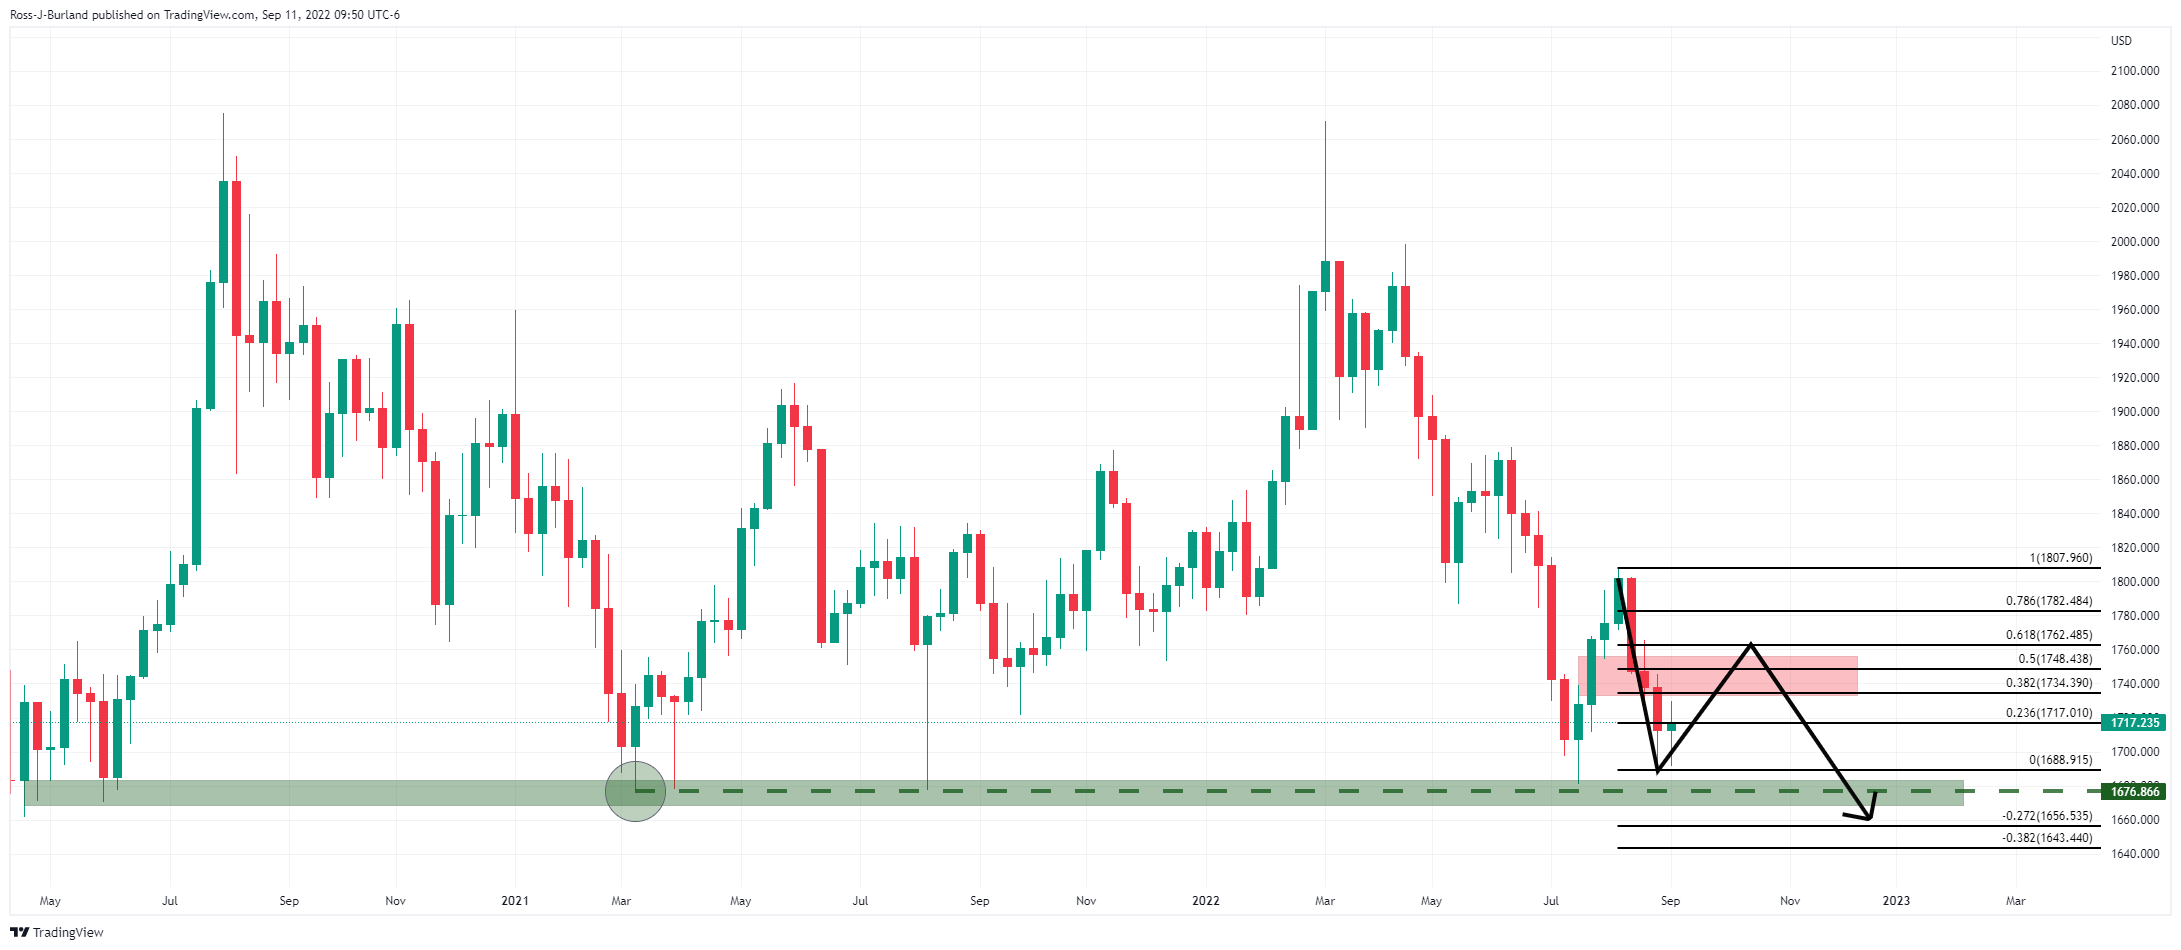
However, the extension of the downside remains probable for a retest of the 2021 lows around $1,676:

Information on these pages contains forward-looking statements that involve risks and uncertainties. Markets and instruments profiled on this page are for informational purposes only and should not in any way come across as a recommendation to buy or sell in these assets. You should do your own thorough research before making any investment decisions. FXStreet does not in any way guarantee that this information is free from mistakes, errors, or material misstatements. It also does not guarantee that this information is of a timely nature. Investing in Open Markets involves a great deal of risk, including the loss of all or a portion of your investment, as well as emotional distress. All risks, losses and costs associated with investing, including total loss of principal, are your responsibility. The views and opinions expressed in this article are those of the authors and do not necessarily reflect the official policy or position of FXStreet nor its advertisers. The author will not be held responsible for information that is found at the end of links posted on this page.

If not otherwise explicitly mentioned in the body of the article, at the time of writing, the author has no position in any stock mentioned in this article and no business relationship with any company mentioned. The author has not received compensation for writing this article, other than from FXStreet.

FXStreet and the author do not provide personalized recommendations. The author makes no representations as to the accuracy, completeness, or suitability of this information. FXStreet and the author will not be liable for any errors, omissions or any losses, injuries or damages arising from this information and its display or use. Errors and omissions excepted.

The author and FXStreet are not registered investment advisors and nothing in this article is intended to be investment advice.

Recommended Content


Recommended Content

Editors’ Picks

EUR/USD trades with negative bias, holds above 1.0700 as traders await US PCE Price Index

EUR/USD trades with negative bias, holds above 1.0700 as traders await US PCE Price Index

EUR/USD edges lower during the Asian session on Friday and moves away from a two-week high, around the 1.0740 area touched the previous day. Spot prices trade around the 1.0725-1.0720 region and remain at the mercy of the US Dollar price dynamics ahead of the crucial US data.

EUR/USD News

USD/JPY jumps above 156.00 on BoJ's steady policy

USD/JPY jumps above 156.00 on BoJ's steady policy

USD/JPY has come under intense buying pressure, surging past 156.00 after the Bank of Japan kept the key rate unchanged but tweaked its policy statement. The BoJ maintained its fiscal year 2024 and 2025 core inflation forecasts, disappointing the Japanese Yen buyers. 

USD/JPY News

Gold price flatlines as traders look to US PCE Price Index for some meaningful impetus

Gold price flatlines as traders look to US PCE Price Index for some meaningful impetus

Gold price lacks any firm intraday direction and is influenced by a combination of diverging forces. The weaker US GDP print and a rise in US inflation benefit the metal amid subdued USD demand. Hawkish Fed expectations cap the upside as traders await the release of the US PCE Price Index.

Gold News

Sei Price Prediction: SEI is in the zone of interest after a 10% leap

Sei Price Prediction: SEI is in the zone of interest after a 10% leap

Sei price has been in recovery mode for almost ten days now, following a fall of almost 65% beginning in mid-March. While the SEI bulls continue to show strength, the uptrend could prove premature as massive bearish sentiment hovers above the altcoin’s price.

Read more

US economy: Slower growth with stronger inflation

US economy: Slower growth with stronger inflation

The US Dollar strengthened, and stocks fell after statistical data from the US. The focus was on the preliminary estimate of GDP for the first quarter. Annualised quarterly growth came in at just 1.6%, down from the 2.5% and 3.4% previously forecast.

Read more

Majors

Cryptocurrencies

Signatures