Gold Price Forecast: XAU/USD benefits from US political woes

XAU/USD Current price: $3,340.43
- Tensions between US President Trump and Fed Chair Powell keep the USD under pressure.
- Upbeat United States data gave a breathe to the American currency.
- XAU/USD retains its bullish bias amid broad US Dollar weakness.
Spot Gold trades at around $3,340 a troy ounce in the American session, easing from its intraday peak of $3,357.99. The bright metal benefited from the broad US Dollar (USD) weakness resulting from headlines indicating that United States (US) President Donald Trump accused Federal Reserve (Fed) Chair Jerome Powell of costing a fortune to the US amid the Fed’s decision to maintain interest rates at high levels.
In the meantime, Powell noted that the Fed would likely have lowered interest rates this year if it weren’t for President Trump’s significant policy changes, while speaking at the central banking forum in Sintra, Portugal, but refrained from responding to Trump’s attacks.
The USD benefited from better-than-anticipated US data released after Wall Street’s opening, as the June ISM Manufacturing Purchasing Managers’ Index (PMI) printed at 49.0, better than the 48.5 previous and the anticipated 48.8. Meanwhile, May JOLTS Job Openings showed the number of job openings on the last business day of the month stood at 7.769 million, better than the 7.3 million expected.
Also, the US Senate passed President Trump’s tax and spending bill after more than 24 hours of negotiations by a slim margin. The vote was 50-50, and Vice President JD Vance cast the tie-breaking vote. The bill will now go to the House of Representatives.
XAU/USD short-term technical outlook
The daily chart for the XAU/USD pair shows it keeps recovering from the low set on Friday at $3.281.90, yet also that sellers defended the upside at around a flat 20 Simple Moving Average (SMA), which converges with the 50% Fibonacci retracement of the $3,452.51/$3,281.90 decline at around $3,350. The 100 and 200 SMAs maintain their upward slopes far below the current level, while technical indicators aim marginally higher, although within neutral levels. The 38.2% Fibonacci retracement provides critical support at $3,325.
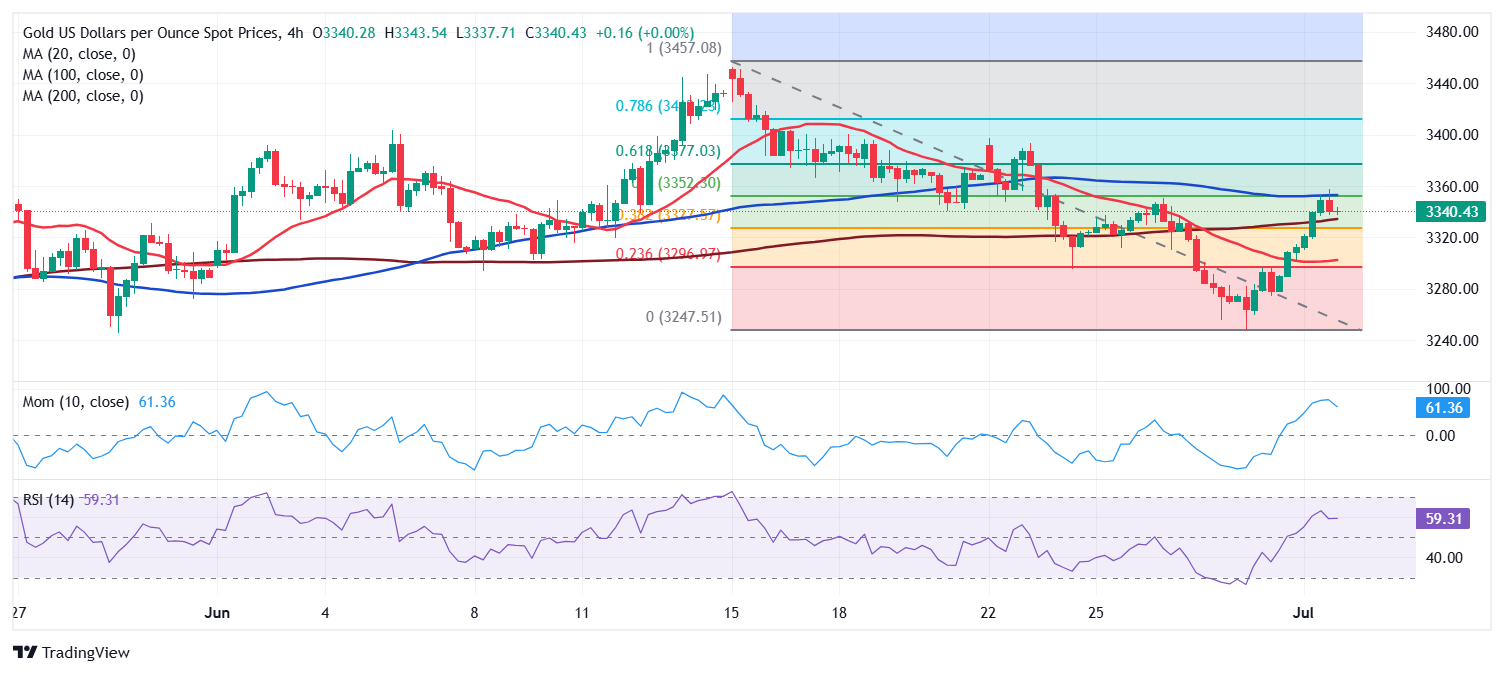
The 4-hour chart for XAU/USD shows technical indicators turned marginally lower after nearing overbought readings. At the same time, a flat 100 SMA stands a few bucks above the aforementioned 50% Fibonacci retracement, reinforcing the resistance area. The 20 and 200 SMAs, in the meantime, lack directional strength, comfortably developing well below the current level. Renewed buying interest beyond the intraday high exposes the next Fibonacci resistance at $3,373.50.
Support levels: 3,325.00 3,311.90 3,295.45
Resistance levels: 3,355.80 3,373.50 3,389.40
Premium
You have reached your limit of 3 free articles for this month.
Start your subscription and get access to all our original articles.
Author

Valeria Bednarik
FXStreet
Valeria Bednarik was born and lives in Buenos Aires, Argentina. Her passion for math and numbers pushed her into studying economics in her younger years.


