Gold Price Forecast: XAU/USD battles for direction, holds above $3,300

XAU/USD Current price: $3,314.85
- Rallying US equities undermine demand for the bright metal.
- Hawkish comments from Fed officials and risks of higher rates hit Gold.
- XAU/USD retreated from around $3,300 and gains downward traction.
Gold price advanced throughout the first half of the day, but retreated in the American session, towards the current $3,310 a troy ounce area. The XAU/USD advanced on broad US Dollar (USD) weakness, a consequence of the latest United States (US) President Donald Trump round of letters.
Trump announced another series of levies through Truth Social on Wednesday, including a fresh 50% tariff on all copper imports starting August 1, while threatened Brazil with a 50% tax, accusing the country of unfair trade practices and of conducting a “which hunt” against former President Jair Bolsonaro.
The mood, however, changed after Wall Street’s opening, with US indexes rallying and weighing on the safe-haven metal. The USD in the meantime, trades mixed across the FX board, firmer against high-yielding rivals, yet falling vs commodity-linked ones.
Meanwhile, hawkish Federal Reserve (Fed) headlines add to Gold weakness. Following the release of the Federal Open Market Committee (FOMC) meeting Minutes on Wednesday, showing policymakers are in no rush to cut rates, came comments from St. Louis Fed President Alberto Musalem. Musalem noted that the economy is in a good place, but highlighted the risks from tariffs. He noted he expect the effects of tariffs to show on upcoming June data, adding a clearer picture could be seen in the summer.
Finally, JP Morgan CEO, Jamie Dimon, said he would price in a 40%-50% chance of higher US interest rates, adding he believes markets are underestimating the risk of higher US rates.
XAU/USD short-term technical outlook
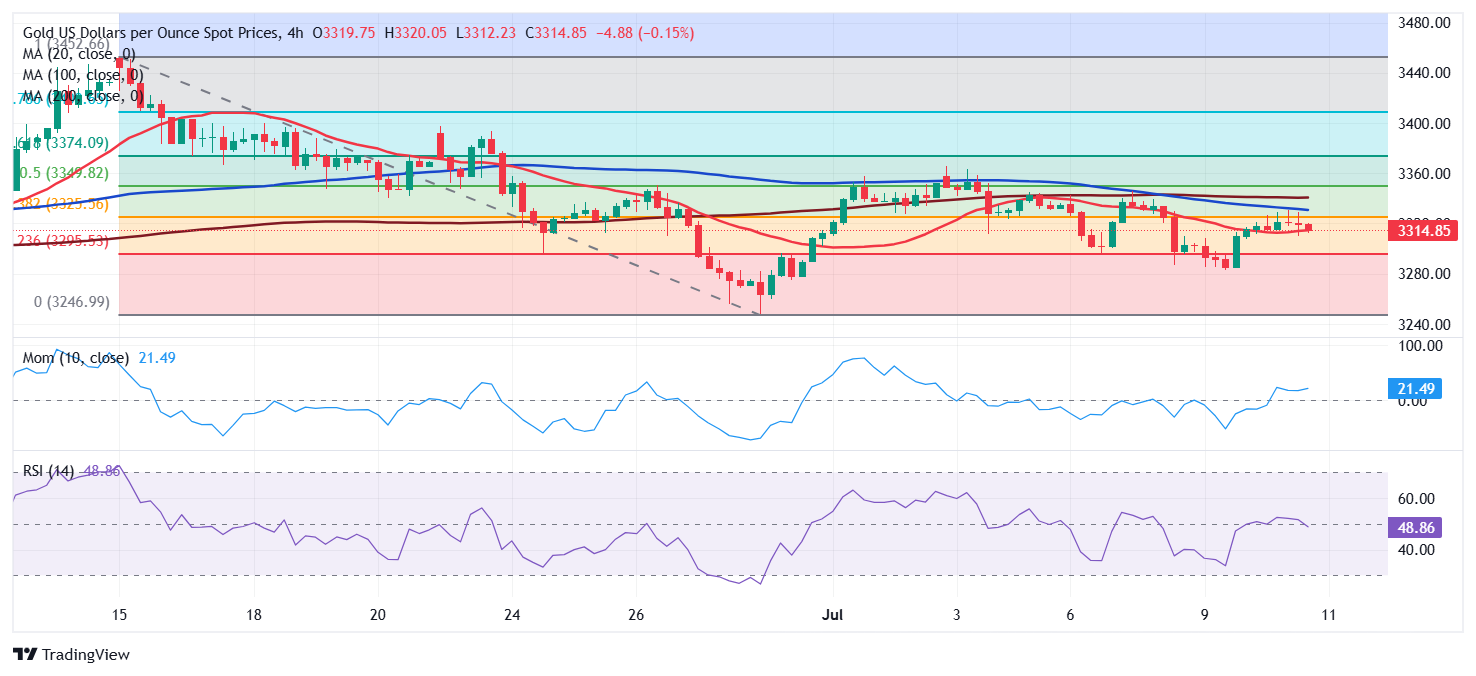
The daily chart shows that the XAU/USD pair struggles around its daily opening, while still trading between Fibonacci levels. The pair is currently below the 38.2% retracement of the June slide at around $3,325, failing on an early attempt to run beyond the level. The next Fibonacci support, comes at 3,295.50. Other than that, the pair keeps developing below a mildly bearish 20 Simple Moving Average (SMA), currently at around $3,350, while technical indicators remain lifeless just below their midlines.
The near-term picture hints at lower lows ahead. In the 4-hour chart, XAU/USD is piercing a directionless 20 SMA, while the upside remains contained by a bearish 100 SMA in the $3,330 region. Finally, technical indicators gain downward traction within negative levels, reflecting the ongoing slide rather than anticipating another leg lower.
Support levels: 3,295.50 3,287.40 3,274.50
Resistance levels: 3,325.00 3,350.00 3,373.40
US-China Trade War FAQs
Generally speaking, a trade war is an economic conflict between two or more countries due to extreme protectionism on one end. It implies the creation of trade barriers, such as tariffs, which result in counter-barriers, escalating import costs, and hence the cost of living.
An economic conflict between the United States (US) and China began early in 2018, when President Donald Trump set trade barriers on China, claiming unfair commercial practices and intellectual property theft from the Asian giant. China took retaliatory action, imposing tariffs on multiple US goods, such as automobiles and soybeans. Tensions escalated until the two countries signed the US-China Phase One trade deal in January 2020. The agreement required structural reforms and other changes to China’s economic and trade regime and pretended to restore stability and trust between the two nations. However, the Coronavirus pandemic took the focus out of the conflict. Yet, it is worth mentioning that President Joe Biden, who took office after Trump, kept tariffs in place and even added some additional levies.
The return of Donald Trump to the White House as the 47th US President has sparked a fresh wave of tensions between the two countries. During the 2024 election campaign, Trump pledged to impose 60% tariffs on China once he returned to office, which he did on January 20, 2025. With Trump back, the US-China trade war is meant to resume where it was left, with tit-for-tat policies affecting the global economic landscape amid disruptions in global supply chains, resulting in a reduction in spending, particularly investment, and directly feeding into the Consumer Price Index inflation.
Author

Valeria Bednarik
FXStreet
Valeria Bednarik was born and lives in Buenos Aires, Argentina. Her passion for math and numbers pushed her into studying economics in her younger years.