Gold Price Forecast: XAU/USD at risk of piercing the $4,000 threshold

XAU/USD Current price: $4,049.41
- US-China trade relationship shaping the market’s sentiment and the direction of the USD.
- The UK Consumer Price Index rose by less than anticipated in September.
- XAU/USD flirted with $4,000 before bouncing, risk remains skewed to the downside.
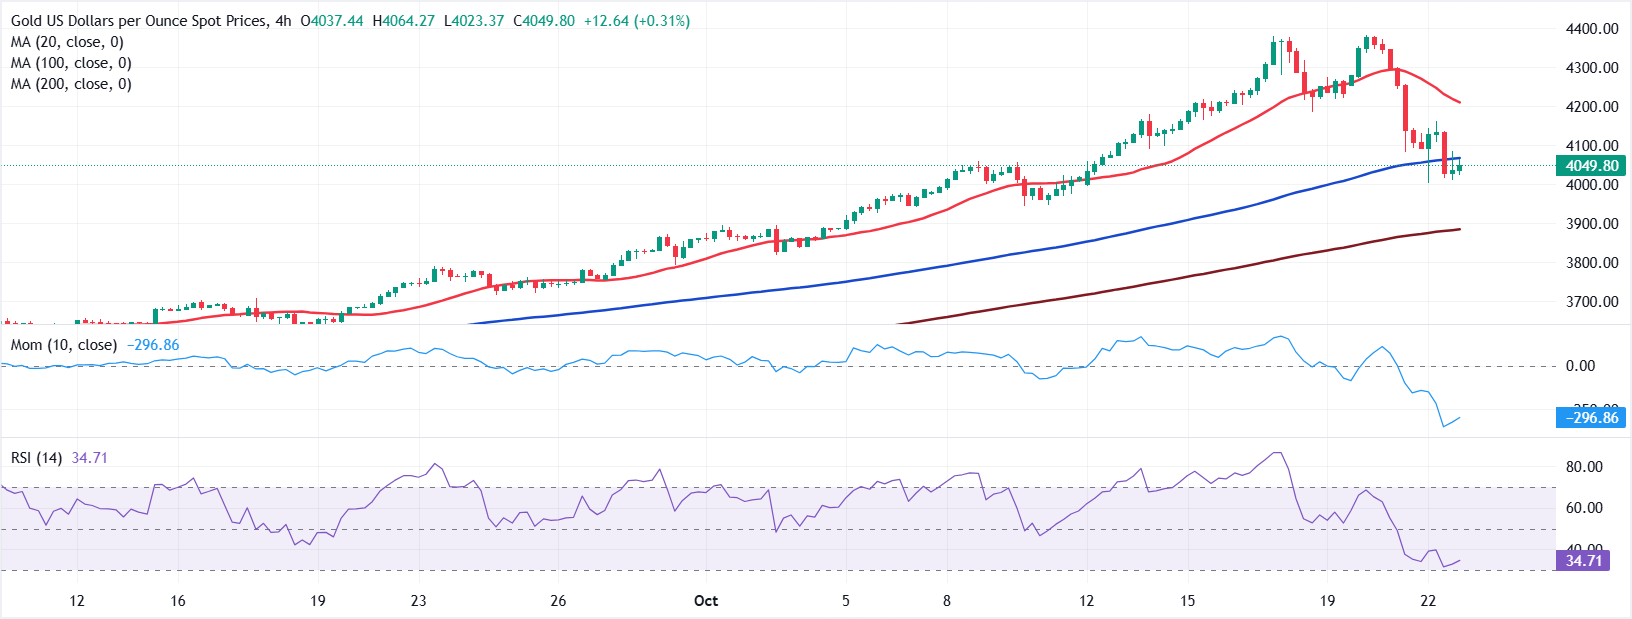
Gold price remained pressured throughout Wednesday, flirting with the $4,000 mark before finding some room to bounce towards the current $4,050 region. The US Dollar (USD) held on to its modest, yet positive momentum throughout the first half of the day, but lost steam after Wall Street’s opening.
Market players were relatively optimistic amid hopes that United States (US) President Donald Trump and his Chinese counterpart, Xi Jinping, would discuss a trade deal and avoid escalating tensions. Things changed when sources familiar with the matter reported that the White House is considering a plan to restrict globally produced exports to China made with or containing US software.
Other than that, the US government shutdown continues. In the twenty-second consecutive day of stalemate, House Speaker Mike Johnson accused Democrats of “eating up the clock” and making it more difficult to do the necessary things on time.
Meanwhile, the United Kingdom (UK) Office for National Statistics (ONS) reported September Consumer Price Index (CPI) figures. Headline inflation rose by 3.8% on year, below the 4.0% anticipated. On a monthly basis, prices remained flat after growing by 0.3% in August. Also, the core annual CPI rose 3.5%, down from the previous 3.6% and also below the 3.7% anticipated by market players. Easing inflation put pressure on the Sterling Pound.
XAU/USD short-term technical outlook
From a technical point of view, the XAU/USD pair is at risk of falling further, particularly if the $4,000 threshold gives up. The daily chart shows that the pair bounced from a bullish 20 Simple Moving Average (SMA), while the 100 and 200 SMAs maintain their bullish slopes far below the shorter one. At the same time, technical indicators extended their slides, heading south within positive levels.
In the near term, and according to the 4-hour chart, XAU/USD is stuck around a bullish 100 SMA, while the 20 SMA gained downward traction above the current level, providing resistance at around $4,025. Finally, technical indicators stand near oversold readings with uneven strength, still skewing the risk to the downside.
Support levels: 4,000.00 3,986.45 3,972.10
Resistance levels: 4,061.20 4,085.70 4,110.00
Author

Valeria Bednarik
FXStreet
Valeria Bednarik was born and lives in Buenos Aires, Argentina. Her passion for math and numbers pushed her into studying economics in her younger years.

















