Gold Price Forecast: Will XAU/USD find acceptance above channel hurdle at $1791?
- Gold price is clinging onto the recent recovery gains amid weaker USD.
- Gold bulls remain wary as US Treasury yields keep rallying amid hawkish Fed.
- Gold price looks to retest rising channel hurdle on the 4H chart, focus on yields.

Gold price extended the rebound from the critical short-term 21-Daily Moving Average (DMA), then at $1761, on Wednesday, storming through the 50-DMA barrier at $1780 to clinch fresh three-day tops at $1788. The extended correction in the US dollar from yearly tops was the main catalyst behind the advance in gold price. The markets remained optimistic amid strong corporate earnings reports, which have put the worries over the rising inflation and economic growth in the back seat. The underlying optimism was reflective on the record run in the Wall Street indices, which dented the greenback’s safe-haven appeal.
However, the further upside remained elusive in gold price amid persistent expectations that the Fed will embark upon monetary policy normalization as early as November, as the US inflation expectations reach an eight-year peak.
On Thursday, gold price added to Thursday’s gains and hit four-day highs at $1789 before reversing slightly. The pullback in gold price comes on the back of a renewed bid put under the dollar, as the market mood worsened amid resurfacing worries over the indebted China Evergrande Group. The Chinese property development giant failed to clinch a property sale deal with Hopson Development Holdings, sparking default risks. Investors now digest the latest Reuters update, citing that “Evergrande has won a "more than three-month" extension to the maturity of a $260 million bond issued by joint venture Jumbo Fortune Enterprise and guaranteed by Evergrande beyond Oct. 3, after agreeing to provide extra collateral.”
China Evergrande's fears combined with the ongoing surge in the Treasury yields will likely limit the gold advance, as the sentiment will lead the way amid a lack of significant US economic release, except for the weekly Jobless Claims. Also, hawkish signals from the world’s major central banks could also keep a lid on the non-interest-bearing gold.
Gold Price Chart - Technical outlook
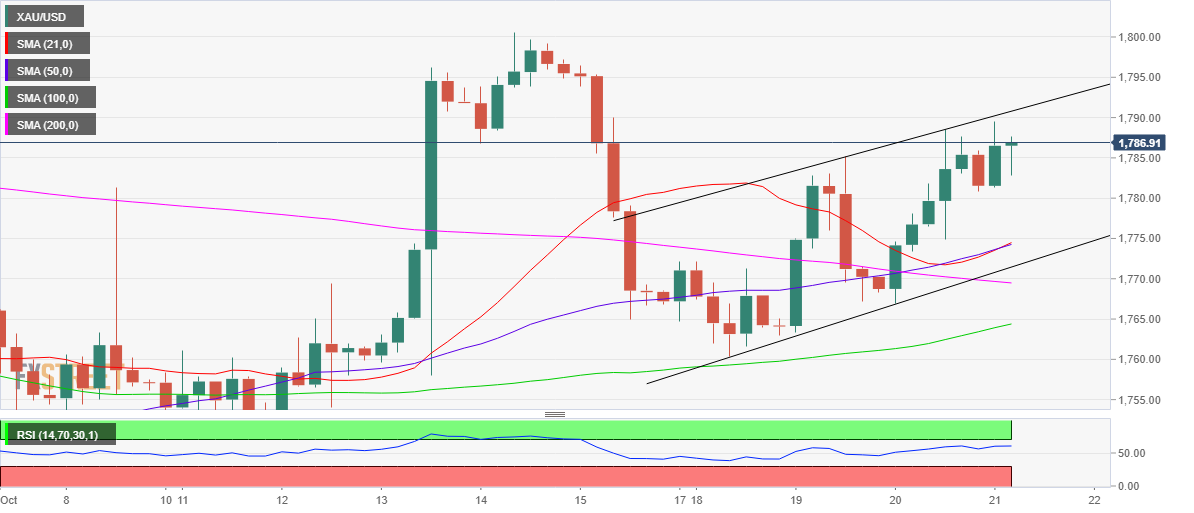
Gold: Four-hour chart
As observed on the four-hour chart, gold price is struggling to hold near the upper boundary of a rising channel formed so far this week.
Immediate upside in gold price is seen capped at the rising trendline resistance at $1791. A sustained break above the latter will yield an upside breakout from the channel, opening doors towards the previous week’s high of $1801.
The Relative Strength Index (RSI) is turning slightly lower but holds well above the midline, suggesting that the upside bias still remains in place in the near term.
Also, the bull cross, represented by the 21-Simple Moving Average (SMA) having cut the 50-SMA from above, adds credence to some additional gains.
However, selling resurgence could see gold price falling back towards the confluence of the 21 and 50-SMAs at $1775.
The next relevant downside target is aligned at the rising trendline support at $1771. A four-hourly closing below the latter will confirm a rising channel breakdown, exposing the immediate support at the bearish 200-SMA at $1769.
Further south, the upward-pointing 100-SMA at $1764 could come to the buyers’ rescue.
Premium
You have reached your limit of 3 free articles for this month.
Start your subscription and get access to all our original articles.
Author

Dhwani Mehta
FXStreet
Residing in Mumbai (India), Dhwani is a Senior Analyst and Manager of the Asian session at FXStreet. She has over 10 years of experience in analyzing and covering the global financial markets, with specialization in Forex and commodities markets.


