Gold Price Forecast: Will XAU/USD confirm a falling channel breakout?
- Gold price tests its luck once again amid an extended USD correction.
- Powell reaffirms hawkish rhetoric, which could keep upside capped in gold.
- XAU/USD eyes a daily closing above $1,712 to confirm a bullish channel.

Amid an extended phase of downside consolidation, Gold price is trying another attempt for a sustained move higher on the final trading day of this week. The US dollar correction extends amid a better market mood, shrugging off the previous rebound in the Treasury yields. The USD-priced bright metal is capitalizing on the renewed dollar weakness while markets resort to position readjustments ahead of next week’s US inflation data, which will be the last data point before the September 21 Fed rate hike announcement and could have a significant impact on the Fed’s pricing. At the moment, the CME FedWatch Tool shows an 85% probability of a 75 bps rate hike this month, up from around 77% seen on Wednesday.
Looking ahead, the end-of-the-week flows and the Fedspeak will be closely eyed for fresh trading opportunities in the non-interest-bearing XAU/USD. It’s worth that the Fed will enter its ‘blackout period’ from Saturday. Additionally, the broader market sentiment will also play a pivotal role amid a data-light US calendar to wrap up an eventful week.
Also read: Gold still weak under a tremendously strong dollar, but good times may return soon
The yellow metal failed to sustain Wednesday’s solid rebound on Thursday and dropped sharply to near $1,700 after Fed Chair Jerome Powell stuck to his hawkish stance, noting that the Fed needed to “act now” and “forthrightly” to bring inflation under control. His comments ramped up a super-sized rate hike expectations for this month and offered a fresh boost to the US dollar. The greenback also firmed up amid a EUR/USD sell-off after a 75 bps rate hike by the ECB failed to rescue EUR bulls, as concerns over a likely recession in 2023 amid the deepening energy crisis outweighed. However, the positive close on the European and Wall Street stocks lifted the overall market mood, which lifted gold price at the expense of the safe-haven dollar.
Gold price technical outlook: Daily chart
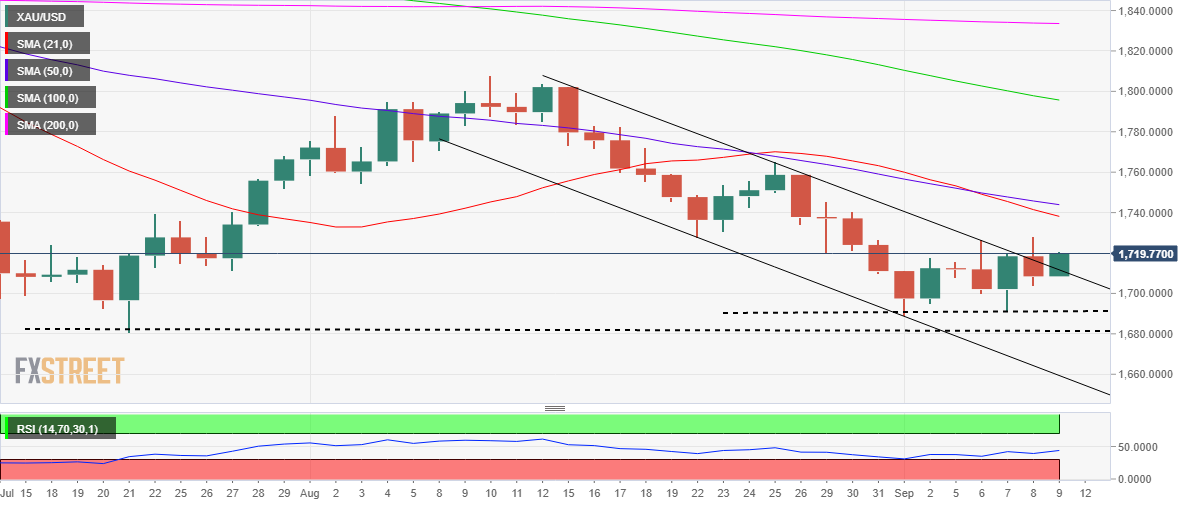
Gold price is breaking above the falling trendline resistance at $1,712, which if confirmed on a daily closing basis will validate a falling channel breakout.
Note that the bullion has been moving within a descending channel after topping out around $1,808 during early August.
An upside break from the channel will offer additional legs to the ongoing recovery from six-week lows, with the bearish 21-Daily Moving Average (DMA) at $1,738 back on buyers’ radars.
Ahead of that, the previous day’s high at $1,728 will challenge bearish commitments.
With the bear cross still in play and the 14-day Relative Strength Index (RSI) lurking below the midline, bulls will trade with caution.
Failure to find a strong foothold above the aforesaid critical resistance at $1,712, sellers will fight back control in the near term.
The $1,700 mark will be put to test once again. A sustained move below the latter will challenge the intermittent lows of around $1,690.
Further down, sellers will look to take out the 2022 low of $1,681 once again.
Premium
You have reached your limit of 3 free articles for this month.
Start your subscription and get access to all our original articles.
Author

Dhwani Mehta
FXStreet
Residing in Mumbai (India), Dhwani is a Senior Analyst and Manager of the Asian session at FXStreet. She has over 10 years of experience in analyzing and covering the global financial markets, with specialization in Forex and commodities markets.


