Gold Price Forecast: Will XAU/USD close the final day of 2022 above $1,825?
- Gold price stays directed to recapture $1,825 amid weak US Treasury bond yields.
- US Dollar pauses its downside as S&P 500 futures turn negative.
- End-of-the-year flows could impact Gold price action, trigger volatility.
- Gold bulls eye yearly closing above $1,825 to confirm an ascending triangle.

Gold price is looking to extend the previous rebound, as bulls remain on track to recapture the critical $1,825 resistance on the final trading day of this year. Gold price is headed for the second straight yearly drop, losing nearly 1%, as the US Federal Reserve (Fed) stepped up its tightening game in order to fight stubbornly-high inflation.
Bidding adieu to 2022, Gold bulls stay hopeful for a recovery next year, as the Fed is expected to shift its gear to a dovish stance amid easing inflation and increased odds of the US economy entering a recession in the second half of 2023. As for Friday’s trading so, the bright metal is preserving gains amid a minor pullback in the US Treasury bond yields. However, a pause in the US Dollar sell-off is challenging bullish attempts, as investors resort to repositioning heading into the New Year holiday weekend.
Thin volumes are likely to persist, keeping Gold price at risk of heightened volatility. The Asian stocks are higher, tracking the rebound in Wall Street indices amid the renewed optimism on the last days of this year. In the day ahead, it remains to be seen if the safe-haven US Dollar can withstand the recovery in risk sentiment. Although the sentiment around the US Treasury bond yields could play a key role in the Gold price action alongside the end-of-the-year flows.
Investors may look past China’s Covid concerns and the stricter response from the rest of the world, for now, as they brace for an upbeat start to the New Year. Thursday’s weekly US Jobless Claims data failed to offer any respite to the US Dollar bulls, as sentiment improvement in the American trading after tech giants rebounded following a sell-off over the past two days.
Gold price technical analysis: Daily chart
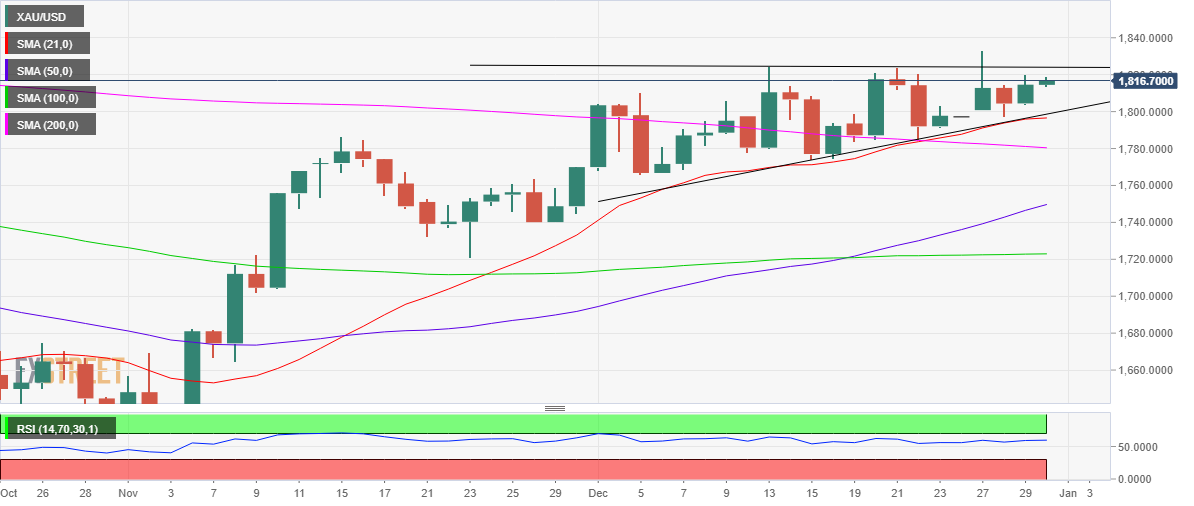
Nothing seems to have changed technically, as Gold price remains supported while traversing within an ascending triangle formation.
Gold bulls yearn for a daily closing above the horizontal trendline (triangle) resistance to confirm the ascending triangle breakout. Buyers will then target the six-month high at $1,833, above which a fresh upswing toward the psychological $1,850 level could be on the cards.
The 14-day Relative Strength Index (RSI) inches higher above the midline, suggesting that there is room for the upside.
Alternatively, immediate support is seen at Thursday’s low of $1,804. A breach of the latter could put Tuesday’s low at $1,800 under threat. The next critical support awaits at $1,797, which is the confluence of the rising trendline (triangle support line) and the bullish 21-Daily Moving Average (DMA). That demand area will be a tough nut to crack for Gold sellers.
Author

Dhwani Mehta
FXStreet
Residing in Mumbai (India), Dhwani is a Senior Analyst and Manager of the Asian session at FXStreet. She has over 10 years of experience in analyzing and covering the global financial markets, with specialization in Forex and commodities markets.


