|

Gold Price Forecast: Ukraine in the eye of the storm, fears boost safe-haven assets

XAU/USD Current price: $1,902.05

  • Russian President Putin to deploy armed forces in Donbass to “protect” people.
  • Market players ignored upbeat US businesses data and Consumer Confidence.
  • XAU/USD is poised to extend gains amid a risk-averse environment.

Spot gold trades in the red on a daily basis at around $1,902.00 a troy ounce, retreating from a fresh multi-month high of 1,914.10. The bright metal gapped higher with Asian markets’ opening, as the decision of Russian President Vladimir Putin to declare the independence of two Republics in the Donbass region, Donetsk and Luhansk. The EU has responded with sanctions while the White House said Russian moves on Ukraine an invasion, which sets the stage for strong sanctions to be imposed on Moscow.

Gold pulled back from the mentioned high as the market’s sentiment improved during London trading hours, sending XAU/USD down to 1,891.36. However, the market mood soured again after the US opening, after the Russian Upper House of Parliament voted in favour of giving  Putin the formal authority to deploy Russia's armed forces abroad to “protect” people. The news has sent Wall Street into the red after a positive start to the day.

Speculative interest ignored macroeconomic releases, but US data was generally encouraging. Markit published February flash PMIs, which showed a wider than anticipated expansion in both the services and the manufacturing sectors. Additionally, CB Consumer Confidence printed at 110.5 in February, down from the previous 111.1 but better than the 109.9 expected.

Gold price short-term technical outlook

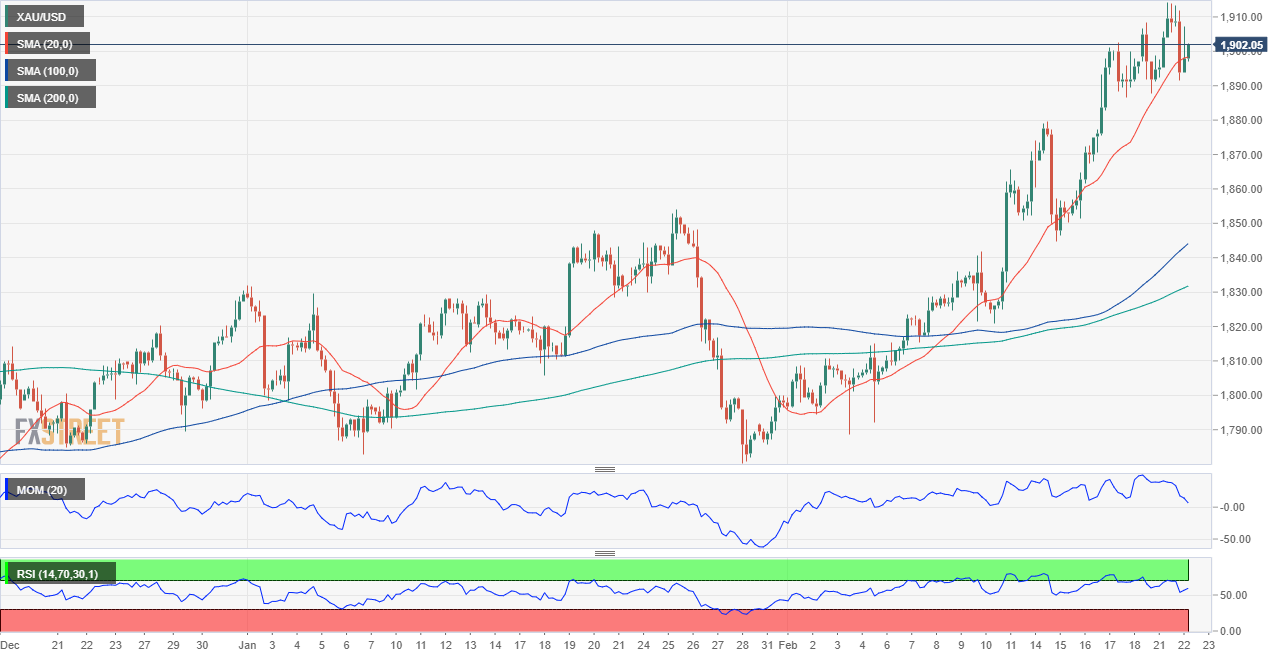
The XAU/USD pair has posted a higher high for a fourth consecutive day, while it also posted a lower low, which means that the bullish potential remains strong. Technical readings in the daily chart reflect bulls’ dominance, as technical indicators keep consolidating within overbought levels as the price develops far above all of its moving averages.

The 4-hour chart shows that technical indicators bounced after nearing their midlines, heading higher within positive levels although with uneven strength. Additionally, gold quickly recovered after briefly piercing a bullish 20 SMA, which advances above the longer ones. A steeper advance could be expected on a break above 1,916.50, June 2021 monthly high, and the immediate resistance level.

Support levels: 1,887.60 1,877.20 1,865.10

Resistance levels: 1,916.50 1,923.70 1,934.70

View Live Chart for the XAU/USD

Premium

You have reached your limit of 3 free articles for this month.

Start your subscription and get access to all our original articles.

Subscribe to PremiumSign In

Author

Valeria Bednarik

Valeria Bednarik was born and lives in Buenos Aires, Argentina. Her passion for math and numbers pushed her into studying economics in her younger years.

More from Valeria Bednarik
Share:

Markets move fast. We move first.

Orange Juice Newsletter brings you expert driven insights - not headlines. Every day on your inbox.

By subscribing you agree to our Terms and conditions.

Editor's Picks

EUR/USD edges higher to mid-1.1600s; looks to US PCE Price Index for fresh impetus

The EUR/USD pair attracts some dip-buyers during the Asian session on Friday and recovers a part of the previous day's retracement slide from the 1.1680 region, or the highest level since October 17. Spot prices currently trade around mid-1.1600s and remain on track to register gains for the second straight week.

GBP/USD: Constructive view prevails above 1.3300 ahead of US PCE inflation data

The GBP/USD pair trades on a flat note near 1.3330 during the Asian trading hours on Friday. Traders prefer to wait on the sidelines ahead of the key US inflation report later on Friday. The US delayed Personal Consumption Expenditures Price Index report for September could offer some hints about the US interest rate path.

Gold flat lines above $4,200 mark; looks to US PCE Price Index for some meaningful impetus

Gold struggles to capitalize on the overnight bounce from the $4,175 area, or the vicinity of the weekly trough, and oscillates in a narrow trading range during the Asian session on Friday. Traders now seem reluctant and opt to move to the sidelines ahead of the September Personal Consumption Expenditures Price Index, or the Federal Reserve's preferred inflation gauge. 

Pi Network: Bearish streak nears critical support trendline

Pi Network edges lower on Friday for the third consecutive day, approaching a local support trendline. The on-chain data suggests an increase in supply pressure as Centralized Exchanges experience a surge in inflows. Technically, the pullback in PI risks further losses, as the Moving Average Convergence Divergence indicator is flashing a sell signal. 

Why the Fed may cut rates in December: Understanding the policy shift

The Fed has gone through a noticeable policy swing in recent months - from initiating a rate cut, to signaling a potential pause, and now shifting once again toward another cut in December. This has created understandable confusion among traders and investors trying to interpret the Fed’s reaction function.

XRP edges lower despite record on-chain activity and steady ETF inflows

Ripple is trading under pressure at the time of writing on Thursday, after bulls failed to break the short-term resistance at $2.22. The reversal may extend toward Monday’s low of $1.98, especially if risk-off sentiment persists in the broader cryptocurrency market.