Gold Price Forecast: The XAU/USD struggle with $3,250 extends, what’s next?

· Gold price keeps range play intact below $3,250 early Tuesday.
· The US Dollar draws support from US trade deals optimism but upside appears limited.
· Gold price remains stuck between 21-day SMA and 50-day SMA amid bearish RSI.
Gold price has returned to red early Tuesday, having failed to take out the $3,250 barrier once again. The downtick in Gold price could be linked to a tepid US Dollar (USD) recovery as traders await US trade talks and Fedspeak for a fresh directional impetus.
Gold price looks to US trade talks and Fedspeak
The USD is looking to stabilize following the previous decline, led by the revival of the ‘Sell America’ theme, which triggered a big sell-off in the US assets across the financial markets. Moody's downgraded the US sovereign credit rating on Friday by one notch from its pristine "Aaa" rating to “Aa1”, withering the ‘Brand USA’.
Investors remained wary about the long-term fiscal picture for the United States (US). “Analysts say Trump's sweeping tax-cut bill would add $3 trillion to $5 trillion to the nation's $36.2 trillion in debt over the next decade,” per Reuters.
In response, risk-off flows dominated on Monday and lifted the traditional safe-haven Gold price.
In Tuesday’s trading so far, the Greenback is holding the overnight bounce on renewed optimism over the potential US trade deals with India, South Korea and Japan.
South Korea and the US will meet over a second round of technical discussions on Tuesday in Washington over the latter’s reciprocal tariff measures. The talks will span over three days. Meanwhile, Bloomberg reported that India is discussing the US trade deal structured in three tranches, with an interim agreement likely before July.
Increased hopes of a ceasefire between Russia and Ukraine also act as a headwind to the traditional store of value, Gold. US President Donald Trump spoke with President Vladimir Putin on Monday and said Russia and Ukraine would immediately start negotiations toward a ceasefire, but the Kremlin said reaching an agreement would take time, while Trump indicated he was not ready to join Europe with fresh sanctions to pressure Moscow.
However, the Greenback stalled its recovery, tracking the sharp decline in the Japanese Yen (JPY) after Japan's Finance Minister Katsunobu Kato hinted at holding FX talks with US Treasury Secretary Scott Bessent this week.
This has helped the bright metal limit its downside. Looking ahead, it remains to be seen if Gold price holds firm to bearish pressures. Speeches from a bunch of Federal Reserve (Fed) policymakers and trade talks will continue to drive the USD’s performance and the Gold price action, in the absence of high-impact US data releases.
Gold price technical analysis: Daily chart
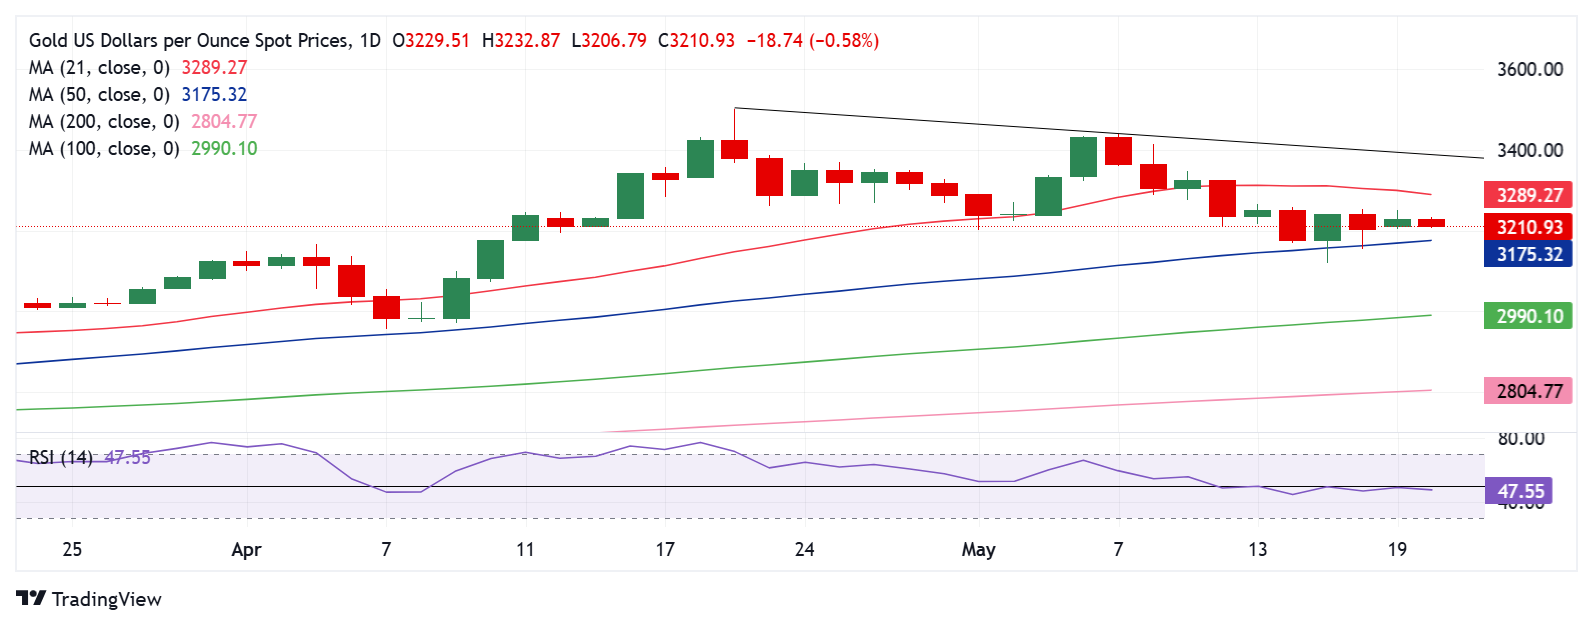
Technically, Gold price remains confined in a range, with the upside capped by the 21-day Simple Moving Average (SMA) at $3,289 while buyers continue to find support at the 50-day SMA at $3,175.
The 14-day Relative Strength Index (RSI) sits beneath the midline, near 47.50, maintaining the downside risks.
So long as the price stays above the throwback support of the 50-day SMA, a brief recovery toward the 21-day SMA remains in the offing.
However, Gold buyers need to take out the immediate resistance at the $3,250 psychological level to march toward the 21-day SMA.
The next topside target is at the falling trendline resistance at $3,386.
On the downside, if sellers manage to crack the 50-day SMA on a daily closing basis, a fresh sell-off could be fuelled toward the $3,100 mark.
The April 10 low of $3,072 would then come to the rescue of buyers.
Gold FAQs
Gold has played a key role in human’s history as it has been widely used as a store of value and medium of exchange. Currently, apart from its shine and usage for jewelry, the precious metal is widely seen as a safe-haven asset, meaning that it is considered a good investment during turbulent times. Gold is also widely seen as a hedge against inflation and against depreciating currencies as it doesn’t rely on any specific issuer or government.
Central banks are the biggest Gold holders. In their aim to support their currencies in turbulent times, central banks tend to diversify their reserves and buy Gold to improve the perceived strength of the economy and the currency. High Gold reserves can be a source of trust for a country’s solvency. Central banks added 1,136 tonnes of Gold worth around $70 billion to their reserves in 2022, according to data from the World Gold Council. This is the highest yearly purchase since records began. Central banks from emerging economies such as China, India and Turkey are quickly increasing their Gold reserves.
Gold has an inverse correlation with the US Dollar and US Treasuries, which are both major reserve and safe-haven assets. When the Dollar depreciates, Gold tends to rise, enabling investors and central banks to diversify their assets in turbulent times. Gold is also inversely correlated with risk assets. A rally in the stock market tends to weaken Gold price, while sell-offs in riskier markets tend to favor the precious metal.
The price can move due to a wide range of factors. Geopolitical instability or fears of a deep recession can quickly make Gold price escalate due to its safe-haven status. As a yield-less asset, Gold tends to rise with lower interest rates, while higher cost of money usually weighs down on the yellow metal. Still, most moves depend on how the US Dollar (USD) behaves as the asset is priced in dollars (XAU/USD). A strong Dollar tends to keep the price of Gold controlled, whereas a weaker Dollar is likely to push Gold prices up.
Premium
You have reached your limit of 3 free articles for this month.
Start your subscription and get access to all our original articles.
Author

Dhwani Mehta
FXStreet
Residing in Mumbai (India), Dhwani is a Senior Analyst and Manager of the Asian session at FXStreet. She has over 10 years of experience in analyzing and covering the global financial markets, with specialization in Forex and commodities markets.


