Gold and Copper reveal a deeper commodity divergence

Gold is making new all time highs, and headlines across financial media are focusing almost exclusively on the metal’s renewed appeal as a store of value. Yet the most important message coming from commodity markets is not the gold rally itself. It is the divergence forming beneath the surface between gold and copper, a split that reveals how investors are positioning for a new macro phase rather than a single inflation or risk event.
While gold reflects the market’s search for protection in an uncertain policy environment, copper represents a slower but more durable expression of structural demand tied to industrial activity, electrification and long term capital investment. Together, the two metals are outlining a bifurcated commodity regime that is likely to define the transition into 2026.
Gold rallies as confidence, not panic, drives flows
The recent surge in gold prices is often described as a reaction to fear. In reality, the current rally looks more controlled and more strategic than panic driven episodes of the past. Inflation expectations have stabilized, central banks are no longer aggressively tightening, and yet gold continues to attract steady inflows.
This suggests that the market is not hedging against runaway inflation, but against uncertainty around policy paths, growth distribution and geopolitical alignment. Gold is being used less as an emergency hedge and more as a strategic anchor within diversified portfolios.
The Renko structure highlights this distinction clearly. Price advanced in a disciplined sequence, breaking higher without the volatility spikes typically associated with fear driven moves. Even after printing a fresh high, the subsequent pullback has been orderly, respecting key structural levels rather than collapsing under profit taking pressure.
The technical structure confirms accumulation, not exhaustion
On the Renko chart, gold accelerated into the 4500 area, where selling pressure emerged near the recent high. This reaction is technically healthy. Markets that move vertically without pause tend to correct violently. Here, the pause is measured.
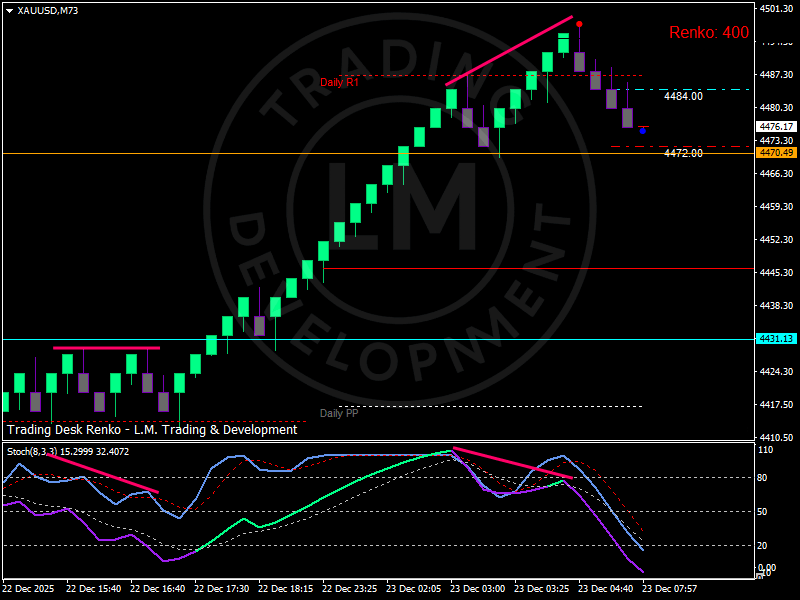
Support around the mid 4400s continues to act as a reference zone. As long as price holds above that area, the broader structure remains constructive. Momentum indicators show cooling rather than reversal, consistent with consolidation following a strong impulse rather than trend exhaustion.
This behavior reinforces the idea that gold is being accumulated on dips, not abandoned after the headline move.
Copper tells a different but complementary story
While gold captures attention through visible price action, copper is sending a quieter message. Copper has been advancing over a much longer horizon, driven by investment cycles rather than short-term macro data. Demand linked to electrification, data infrastructure, energy transition and industrial rebuilding has been building steadily, even as global growth headlines remain mixed.
Unlike gold, copper does not react sharply to CPI prints or central bank decisions. Its pricing reflects expectations around real economy demand over multiple years. This is why copper charts often appear slow and uneventful in the short term, yet powerful in defining long term commodity leadership.
The key insight is not that gold is outperforming copper, but that both are rising for different reasons. Gold expresses macro uncertainty. Copper expresses structural confidence in future industrial demand.
A bifurcated commodity regime is taking shape
This divergence between gold and copper reveals an important shift in how commodities are being used within portfolios. Energy markets remain range bound as supply and demand balance adjusts. Agricultural markets are increasingly driven by physical constraints such as water stress and input availability. Metals, however, are splitting into two distinct roles.
Precious metals are absorbing policy uncertainty and geopolitical risk. Industrial metals are reflecting long term investment themes that extend beyond the current cycle. This split suggests that commodity exposure is becoming more selective, favoring assets with clear functional roles rather than broad inflation hedges.
Why this matters beyond metals
The implications of this divergence extend into broader macro strategy. A world where gold and copper both perform is not one defined by crisis. It is one defined by uneven growth, fragmented policy paths and targeted capital deployment.
For central banks, this environment complicates policy transmission. For investors, it rewards precision rather than blanket positioning. For commodity markets, it signals that leadership is shifting toward assets that combine either monetary relevance or structural necessity.
Gold’s strength alone would be an incomplete signal. Copper’s persistence adds the missing dimension.
Outlook into 2026
Looking ahead, gold is likely to remain supported as long as policy uncertainty and geopolitical realignment persist. Pullbacks should continue to attract interest rather than trigger wholesale reversals, provided key structural levels hold.
Copper’s role is less about short-term price targets and more about confirming the durability of the investment cycle. As long as industrial demand expectations remain intact, copper’s slower trajectory reinforces the idea that the commodity complex is entering a phase of selective strength rather than uniform inflation driven rallies.
Together, gold and copper are not contradicting each other. They are describing different sides of the same macro transition.
Conclusion
Gold’s new highs are capturing attention, but copper’s steady advance is telling an equally important story. The commodity market is no longer moving as a single block responding to inflation headlines. It is fragmenting into assets that serve distinct macro functions.
Gold reflects the need for protection in a world of policy uncertainty. Copper reflects confidence in long term industrial demand. This divergence marks a deeper transition in how commodities are priced and positioned.
Rather than signaling excess, the current gold rally fits within a broader framework where safety and growth coexist. Understanding that balance will be key to navigating commodity markets as the cycle moves toward 2026.
Author

Luca Mattei
LM Trading & Development
Luca Mattei is a market analyst focusing on FX, metals, and macroeconomic trends. He develops trading tools for retail and professional traders, coding indicators and EAs for MT4/MT5 and strategies in Pine Script for TradingView.


