Gold Price Forecast: Strenghtening odds of corrective rally
- Gold created long-legged doji yesterday, signaling bearish exhaustion.
- Strong bullish divergence seen in 4-hour chart indicates scope for a corrective rally.

The probability that gold will revisit the double top neckline hurdle (former support) of $1,302 has increased since the last update.
To start with, gold created a long-legged doji on Monday as seen in the chart below, adding credence to the bearish exhaustion highlighted by the previous long-tailed daily candles.
Daily chart
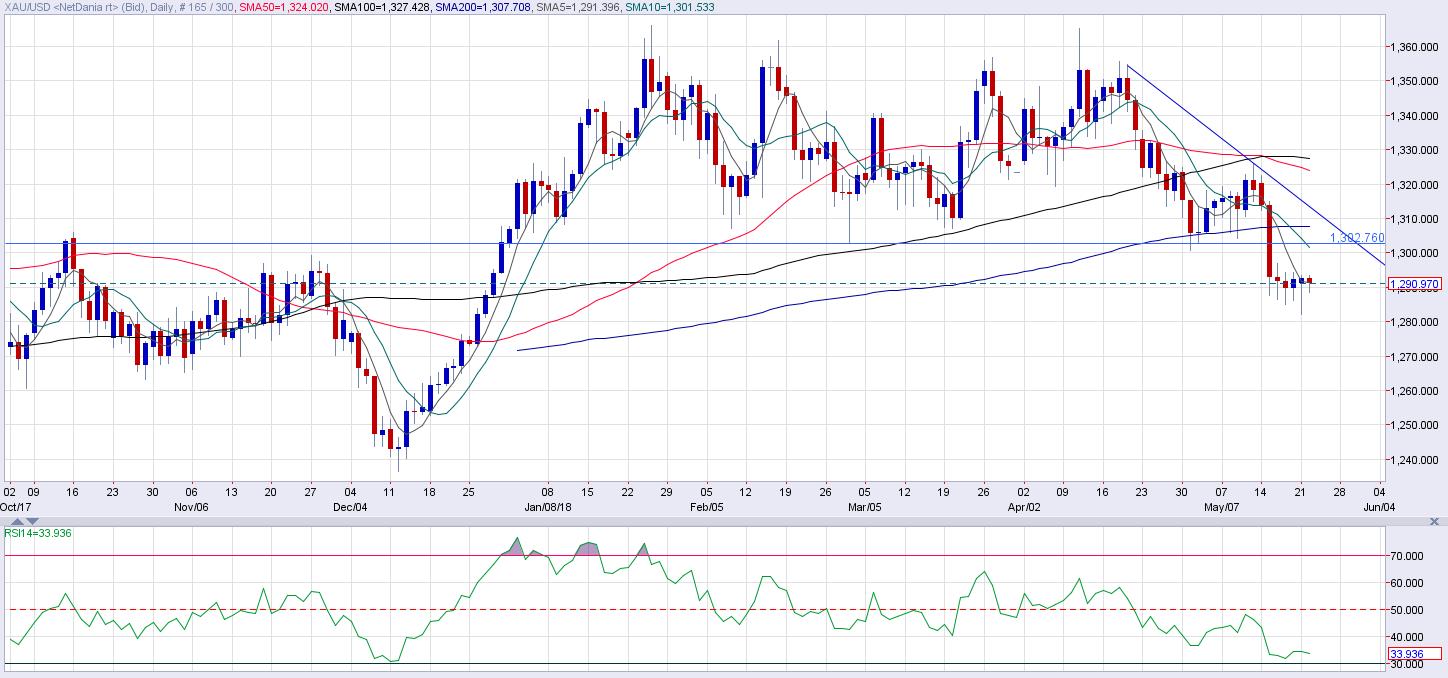
Source: Netdania
The long-legged doji has also established $1,282 as a strong support. A positive follow-through (today) to yesterday's long-legged doji would confirm a bullish doji reversal, although the short-term outlook would turn bullish only if the metal finds acceptance above the descending trendline.
4-hour chart
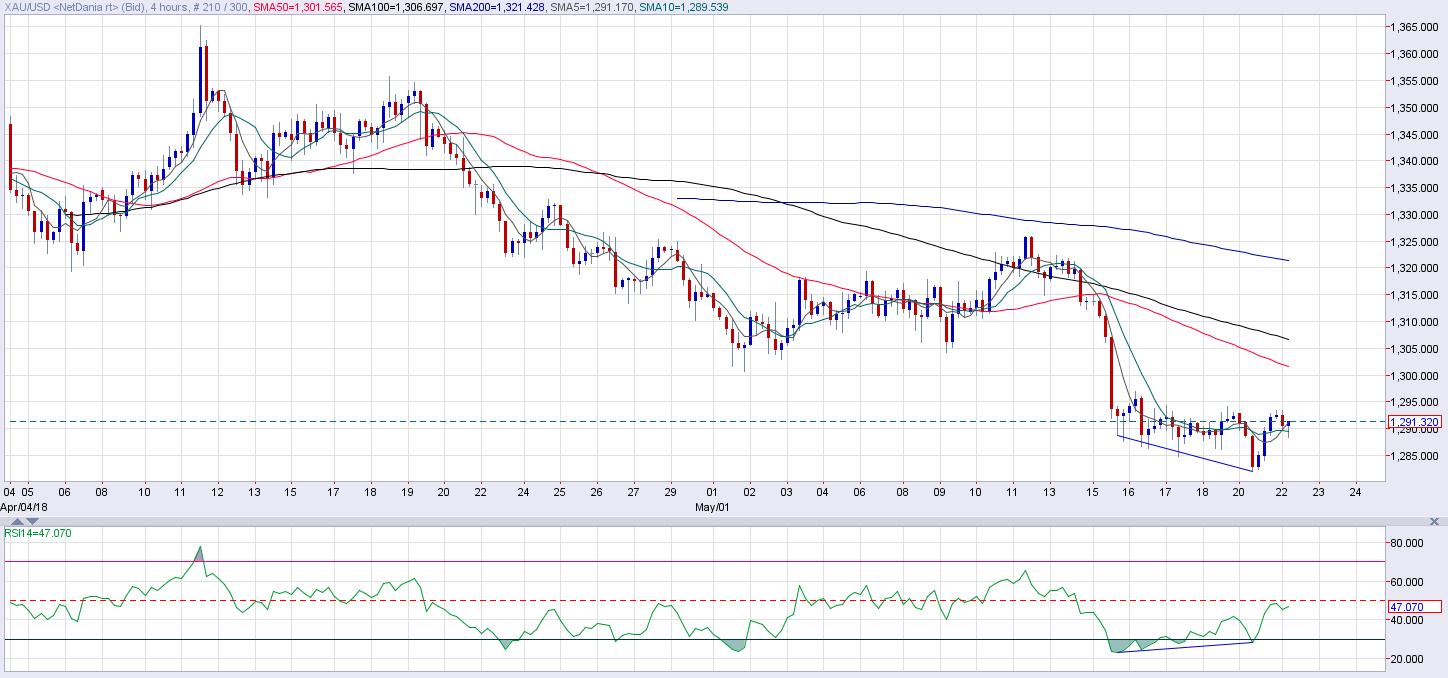
Source: Netdania
The bullish price-relative strength index (RSI), discussed in Friday's update, now looks more convincing, courtesy of yesterday's sharp recovery from $1,282 to $1,292. The 5,10 candle moving average (MA) in the 4-hour chart have bottomed out and are beginning to roll over in favor of the bulls.
Thus, the metal could test $1,300 - $1,302 (Double top neckline) before the weekend.
Bull reversal Scenario: As noted earlier, an unexpected move above the descending trendline (seen in the daily chart) would signal a short-term bull reversal. Meanwhile, in a larger scheme of things, only a convincing move above the 50-month MA would indicate a resumption of the rally from the December 2015 low of $1,046.
Key support: $1,182 (previous day's low), $1,277 (100-week MA), $1,267 (76.4% Fib R of Dec-Jan rally).
Key resistance: $1,297 (50-week MA), $1,302 (double top neckline + 10-day MA), $1,308 (10-week MA).
Author

Omkar Godbole
FXStreet Contributor
Omkar Godbole, editor and analyst, joined FXStreet after four years as a research analyst at several Indian brokerage companies.


