Gold Price Forecast: Double Top breakdown confirmed, but $1,302 could be revisited
- The gold weekly chart shows the double top bearish reversal.
- 4-hour chart shows bullish RSI divergence, hence the neckline resistance - $1,302 could be put to test.

Gold (XAU/USD) is set to end the week well below $1,302, confirming a double top bearish reversal. The pattern indicates the rally from the December 2016 low of $1,122 has ended and the bears are back in the driver's seat.
Weekly chart
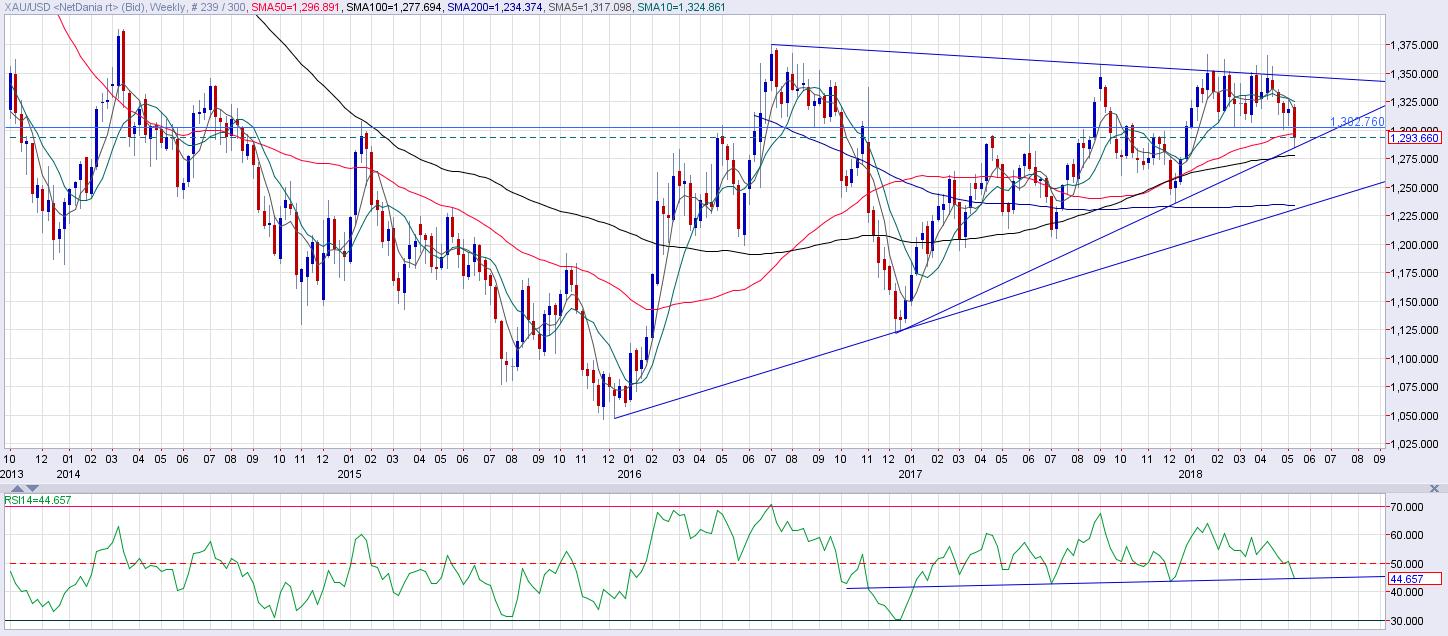
Chart source: Netstation, Netdania
The double top reversal has opened the doors to $1,240 - target as per the measured height method.
The 5-week moving average (MA) and the 10-week MA are sloping downwards in favor of the bears. Further, the relative strength index (RSI) is close to confirming a head-and-shoulders breakdown. Clearly, the odds are stacked in favor of the bears.
However, the metal may revisit the neckline resistance of $1,302 (former support) next week, the short-duration technical charts indicate.
4-hour chart
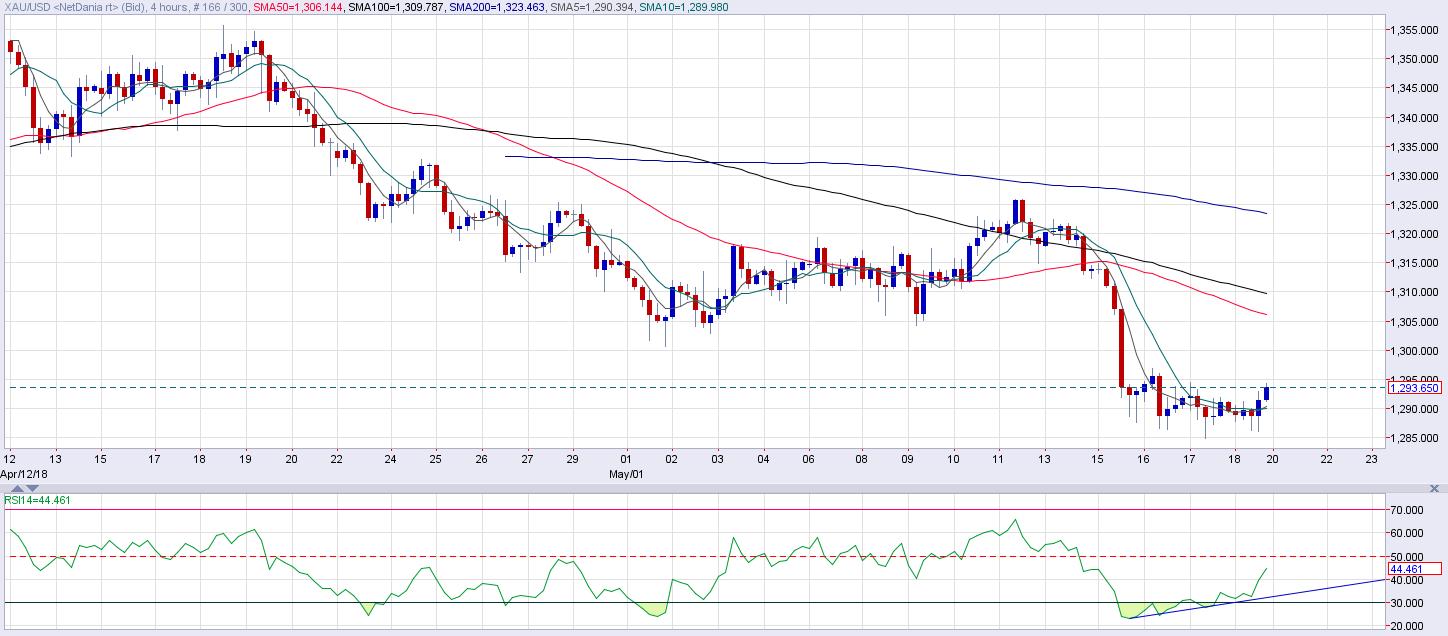
Chart source: Netstation, Netdania
The bullish price RSI divergence indicates a short-term bull reversal and also adds credence to the metal's defense of the ascending trendline (drawn from the December 2016 low and December 2017 low), seen in the weekly chart above.
Daily chart
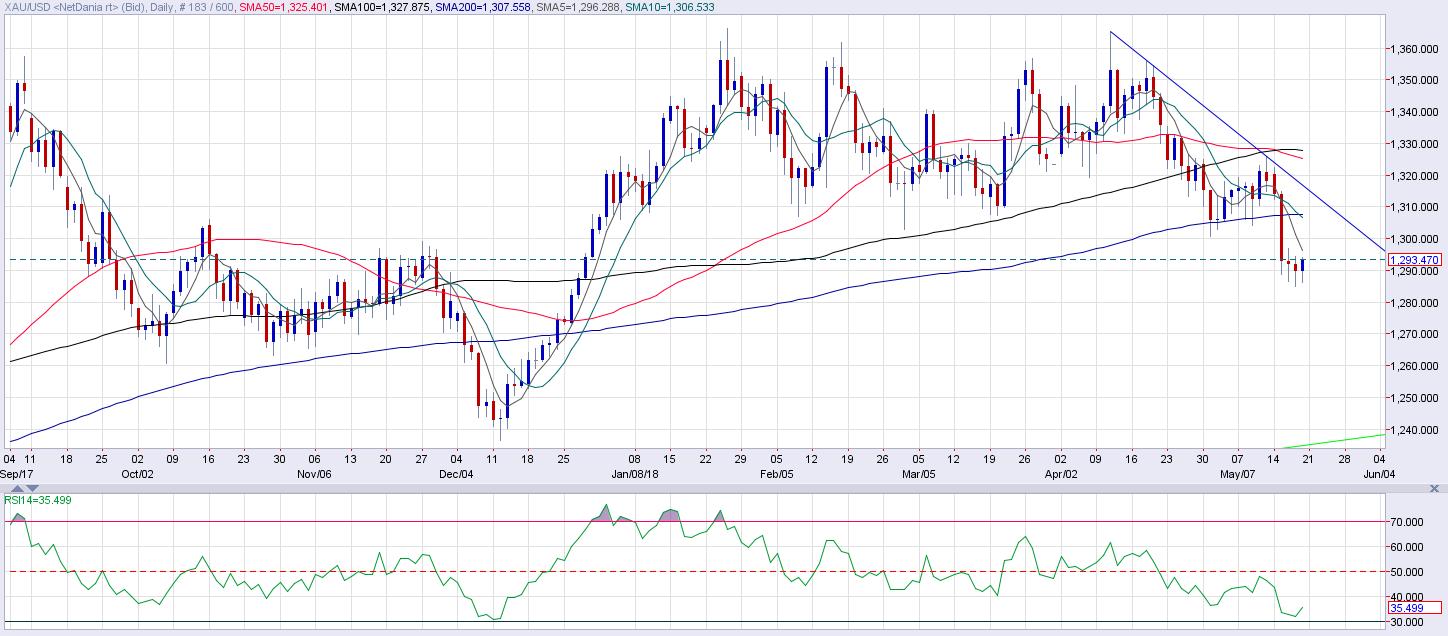
Chart source: Netstation, Netdania
The previous two daily candles have long lower shadows (wicks) which indicate bearish exhaustion. Meanwhile, the positive follow-through seen today has further strengthened the case of a corrective rally to $1,302.
That said, the break above $1,300 will likely be short-lived as the 5-day MA and 10-day MA are trending south, lower highs and lower lows pattern and 10, 200 DMA bearish crossover and 50, 100 DMA bearish crossover.
Only a sustained move above the descending trendline would shift the tide in favor of the bulls.
Author

Omkar Godbole
FXStreet Contributor
Omkar Godbole, editor and analyst, joined FXStreet after four years as a research analyst at several Indian brokerage companies.


