Gold price forecast: Stage set for a rally to $1,400
- Gold best positioned to benefit from rising inflation and asset price deflation.
- Bullish technical setup on the daily and weekly chart.
- XAU/USD risk reversals show strong call bias.

The current narrative in the market is that yields are rising for all the wrong reasons - fiscal indiscipline, rising price pressures.
And hence, the traditional inter market correlations have broken down. Rising bond yields are no longer USD positive and hence they are unlikely to have a negative impact on gold.
Meanwhile, investors fear that Fed could respond to rising inflation by unwinding stimulus at a faster rate. This is putting further pressure on bonds (leading to higher yields). Also, note that rising yields could weigh heavily over stocks as seen a week ago. Thus, it appears gold is best positioned to benefit from rising inflation and asset price deflation.
Read: Balance sheet taper is good news for Gold
As of writing, gold (XAU/USD) looks set to end the week with 2.81 percent gains and the technical charts indicate the rally could be extended further in short-run.
Weekly chart
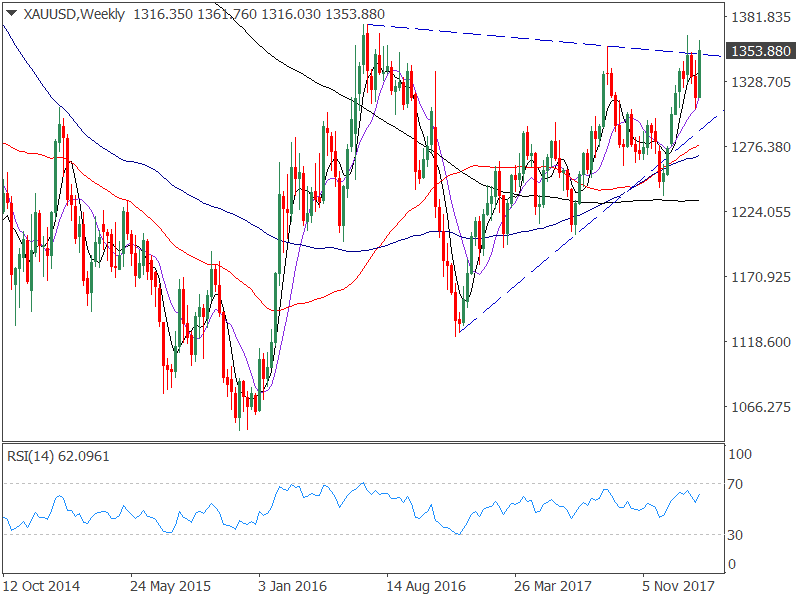
- Bullish symmetrical triangle breakout is on the cards.
- Momentum studies - 5MA and 10MA are curled up in favor of the bulls.
- The relative strength index (RSI) also favors further upside in the yellow metal.
An upside break of the symmetrical triangle pattern would add credence to the rounding bottom formation and would allow for a stronger gain to $1,400 and above.
Daily chart
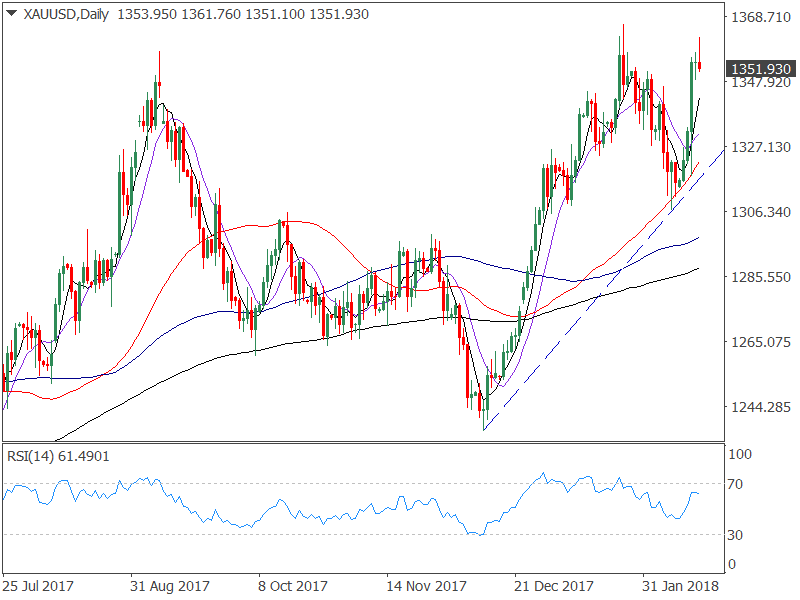
- A higher low along the upward sloping 50-day MA last week as indicated by the rising trendline indicates the bulls are in control.
- The 5-day MA (moving average), 10-day MA are biased bullish. Also, 50-day MA, 100-day MA and 200-day MA are positioned one below the other in a bullish manner.
- The RSI has regained bullish bias and is well short of the overbought territory, indicating room for a rally towards $1,400.
Risk reversals show strong bullish bias
- The XAU/USD 3-month 25 delta risk reversals are being paid at 0.525 XAU calls (highest since September 2017) vs. 0.175 XAU calls a week ago and 0.425 XAU puts in December.
- The one-month 25 delta risk reversals are being paid at 0.40 XAU calls - highest since September. Also the chart shows inverse head and shoulders breakout, meaning the XAU call bias (bullish bias) is likely to strengthen further in the days ahead.
View
- The metal looks set to test $1,375 (July 2016 high) in the short-term and will likely break higher towards $1,400.
- Only a daily close below the rising trendline (seen on the daily chart) would signal signal bullish invalidation.
- Meanwhile, a break below $1,300 would signal short-term bullish-to-bearish trend change.
Author

Omkar Godbole
FXStreet Contributor
Omkar Godbole, editor and analyst, joined FXStreet after four years as a research analyst at several Indian brokerage companies.


