Gold Forecast: Bullish chart setup, $1500 soon?

Gold has rallied more than 8 percent from the December low of $1236.50 and is up approximately 3.3 percent this month. Hence, the daily RSI shows overbought conditions, however, the picture looks super bullish on the monthly chart.
Monthly chart - Rally to $1500 on the cards?
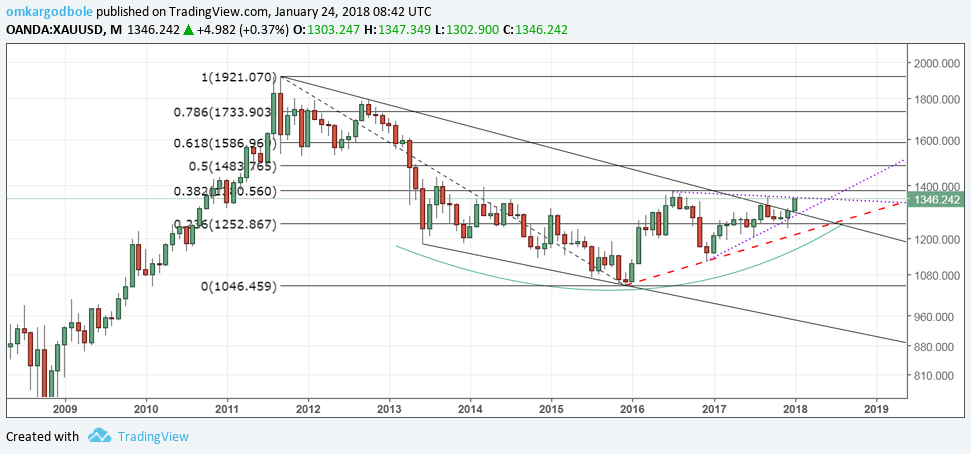
The above chart shows-
- Rounding bottom-like formation.
- Higher lows as represented by the red line.
- An upside break of the falling channel.
- Bullish hammer candle (Dec) at $1252.86 (23.6% Fib R of 2011-2015 sell-off).
- The symmetrical triangle is intact.
The first four points clearly favor a bullish break of the symmetrical triangle pattern. So, a monthly close or multiple weekly closes above $1352 would signal a continuation of the rally from the 2008 low of $681.65. Prices could rise to $1483 (50% Fib R of 2011-2015 sell-off) and $1586 (50% Fib R of 2011 - 2015 sell-off) over 6-8 month period (after break above $1352).
Daily chart - Bearish divergence?
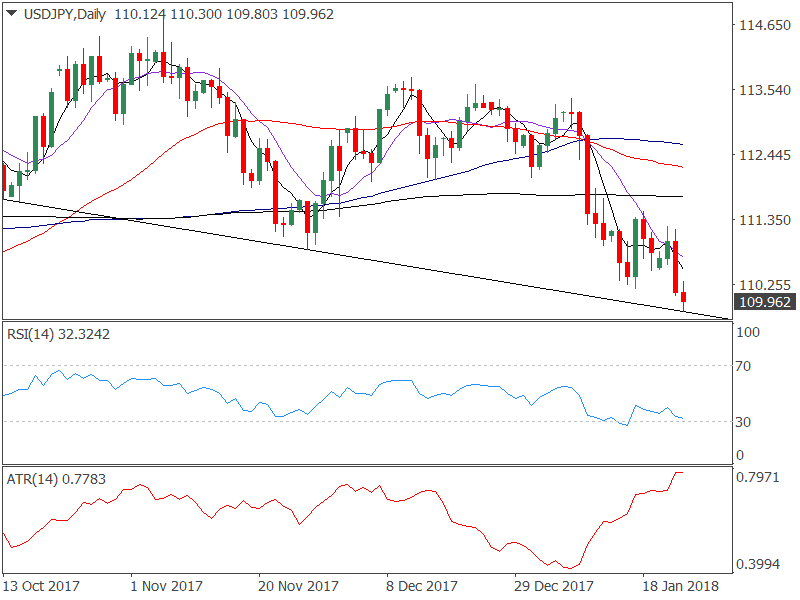
- A rising channel on price (higher highs and higher lows) is accompanied by lower highs on the RSI. The bearish divergence indicates the yellow metal may have a tough time holding above $1352 in the short-run.
- That said, the bullish invalidation is seen only below Jan. 10 low of $1308.22
View
- Break above $1352 likely and rise to $1483 (50% Fib R of 2011-2015 sell-off) could happen before the Q2 end. A violation there would expose $1586 (50% Fib R of 2011 - 2015 sell-off) over 6-8 month period (after break above $1352).
- Short-term pullback likely, but only a weekly close below Jan. 10 low of $1308.22 would abort the bullish view.
Author

Omkar Godbole
FXStreet Contributor
Omkar Godbole, editor and analyst, joined FXStreet after four years as a research analyst at several Indian brokerage companies.


