Gold Price Forecast: Sharp bounce falling short of indicating a trend change

XAUUSD Current price: $1,661.04
- Wall Street shrugged off the negative stance while US government bond yields retreated.
- The dollar’s extreme overbought conditions finally turned into a corrective movement.
- XAUUSD needs to extend its rally beyond $1,688 to sustain the advance.
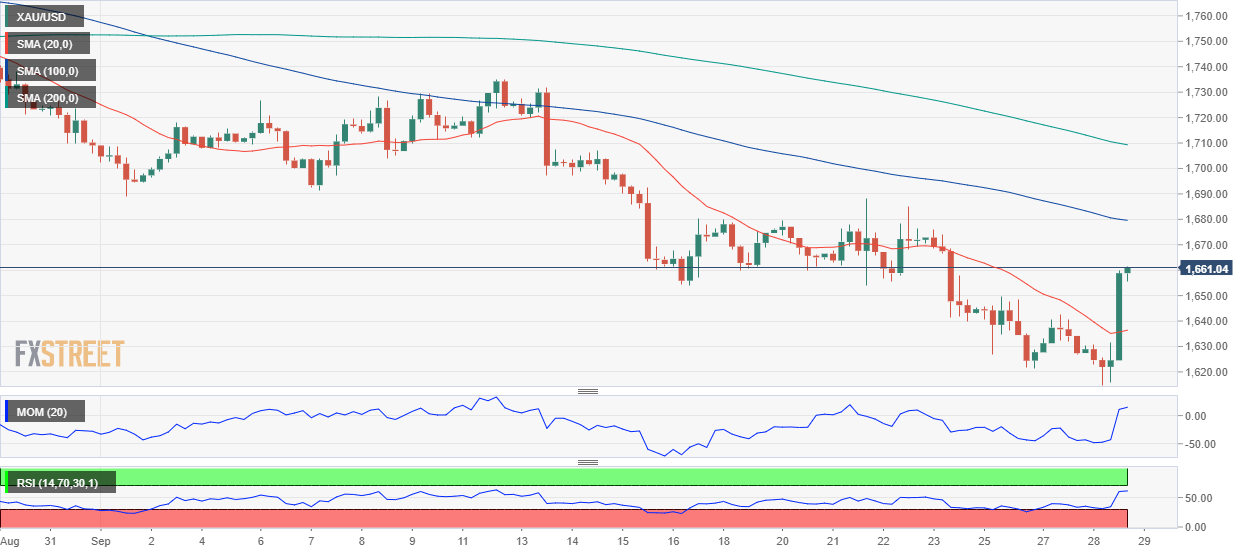
XAUUSD bounced from a fresh two-year low of $1,614.81 a troy ounce as dip buyers appeared on the dollar’s extreme overbought conditions. The bright metal peaked at $1,661.57, its highest for the week, holding above the $1,650 mid-US afternoon.
The dollar strengthened throughout the first half of the day on the back of comments from US authorities, pointing out US economic strength. Nevertheless, the greenback changed course with Wall Street’s opening, without a particular catalyst. True, government bond yields have retreated sharply, with the 2-year Treasury note currently yielding 4.13% and the 10-year note, 3.76%, down roughly 20 points.
At the same time, Wall Street shrugged off its negative tone, with major indexes trading in the green. The main focus remains on central banks and whatever policymakers may or may not do to tame inflation without smashing economic progress. Generally speaking, the US seems to be in much better shape than its major counterparts, and the market is playing that game today. Still, the future seems gloomy, as the path towards steady growth is long and bumpy.
Gold price short-term technical outlook
The daily chart for the XAUUSD pair shows that technical indicators have finally left the extreme oversold territory, maintaining their upward slopes but well below their midlines, leaving the current advance as a corrective movement. The 20 SMA keeps heading south below the longer ones, providing dynamic resistance at around $1,683. Gold topped at $1,688 in the previous week, the level to beat for the current rally to become more sustainable.
Gold is losing bullish strength in the near term, according to the 4-hour chart. Technical indicators have turned flat but hold within positive levels, while the 20 SMA has lost its bearish momentum and now consolidates at around $1,635. The longer moving averages, in the meantime, maintain their firmly bearish slopes far above the current level.
Support levels: 1,649.75 1,634.60 1,621.05
Resistance levels: 1,661.70 1,678.50 1,688.00
Author

Valeria Bednarik
FXStreet
Valeria Bednarik was born and lives in Buenos Aires, Argentina. Her passion for math and numbers pushed her into studying economics in her younger years.


