Gold Price Forecast: Risks appear skewed to the downside, eyes on Powell, US inflation
- Gold price is capping the rebound from three-week lows below $1,800.
- Mixed US jobs report fails to move aggressive Fed rate hike bets.
- Eyes on yields and USD ahead of key US event risks, daily chart leans bearish.

Gold price staged a solid comeback on Friday, bouncing off a fresh three-week low of $1,783 reached in a knee-jerk reaction to the US labor market report. Despite a disappointment in the headlines Nonfarm Payrolls figure, gold price took the hit from an upside surprise in the wage inflation, which suggested that Fed is behind the curve and should accelerate its tightening plans. The US economy added 199K jobs in December vs. 400K expected while the monthly gain in Average Hourly Earnings came in at 0.6%, above expectations for it to rise to 0.4% from November's 0.4% MoM level. Concerns over-aggressive Fed rate hike expectations spooked investors, triggering a sell-off in Wall Street indices, as the Treasury yields spiked to the pre-pandemic levels. The benchmark 10-year yields rose briefly above 1.80%, the highest level since January 2020. Gold bulls were unfazed by surging yields, as the tech sell-off on Wall Street prompted outflows out of the US dollar, aiding the metal’s rebound. The renewed upside, however, remained capped below the $1,800 threshold.
This Monday, gold price is consolidating the previous rebound below $1,800, as investors weigh the impact of aggressive Fed’s tightening and surging covid cases on the global economic recovery. Also, a pause in the yields rally combined with the broad US dollar rebound leaves gold price struggling for a fresh impetus amid holiday-thinned trading. Markets will remain cautious heading into Fed Chair Jerome Powell’s testimony and US inflation data, as Fed speculation will continue influencing the yields and the dollar’s price action, in turn, impacting gold valuations.
Gold Price Chart - Technical outlook
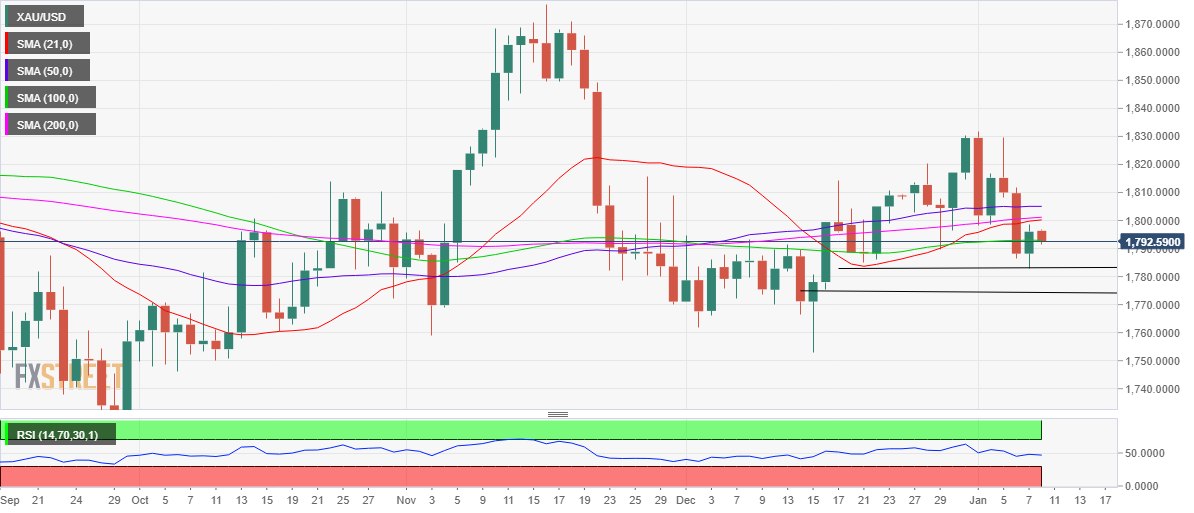
Gold: Daily chart
Having faced rejection just under $1,800, gold price is looking to extend its downtick below the 100-Daily Moving Average (DMA) at $1,793.
The $1,800 mark comprises the convergence of the 200 and 21-DMAs, making it a powerful upside hurdle.
The 14-Relative Strength Index (RSI) is inching lower, sitting beneath the midline, suggesting that the downside potential remains intact.
Friday’s low of $1,783 appears the next support, below which the December 16 lows of $1,776 will come into play.
On the flip side, acceptance above $1,800 is critical to resuming a meaningful recovery towards the horizontal 50-SMA at $1,805.
Thursday’s high of $1,812 will be probed if bulls flex their muscles towards the monthly highs near $1,830 levels.
Premium
You have reached your limit of 3 free articles for this month.
Start your subscription and get access to all our original articles.
Author

Dhwani Mehta
FXStreet
Residing in Mumbai (India), Dhwani is a Senior Analyst and Manager of the Asian session at FXStreet. She has over 10 years of experience in analyzing and covering the global financial markets, with specialization in Forex and commodities markets.


