|premium|

Gold Price Forecast: Holding onto $2010 critical ahead of a big week

  • Gold’s downside capped, as the US dollar struggles with its recovery.
  • Technical indicators signal further correction in the offing.
  • US-China tensions, US CPI and fiscal stimulus talks in focus.

Friday’s sharp corrective pullback in Gold (XAU/USD) was mainly driven by the broad-based US dollar rebound, as the US-China tech war escalation and US fiscal wrangling reinforced the haven demand for the greenback. Better US payrolls report, further, aided the dollar recovery from two-year lows. The bright metal dropped nearly 1.50% and settled at $2035 on Friday.

Heading into a fresh week, gold remains on the defensive amid a broadly subdued US dollar. The haven demand for the US currency could resurface, as uncertainty over the US fiscal aid looms even after President Donald Trump signed coronavirus relief orders on Saturday. House Speaker Nancy Pelosi and Treasury Secretary Steven Mnuchin said they were open to restarting COVID-19 aid talks. Further, the escalation in the US-China tensions following the ban on the Chinese tech-titans could likely bode well for the US dollar and cap the upside attempts in gold. Also, investors remain wary ahead of the US CPI release and August 15 trade talks between the world’s two biggest economies.

Short-term technical perspective  

Gold: Hourly chart

fxsoriginal

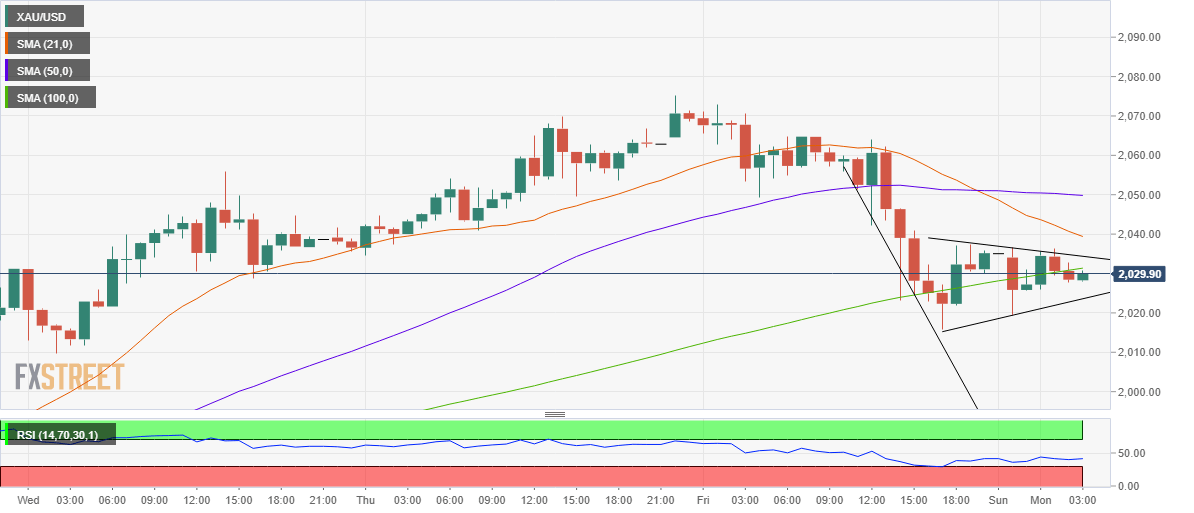
A potential bear pennant formation is spotted on the hourly chart, which is a bearish continuation pattern. Acceptance under $2023 will confirm the pattern, opening doors for a test of Friday’s low at $2015.

The next support at Wednesday’s low of $2009 will be tested, as the sellers eye for a break below $2000. The hourly-Relative Strength Index (RSI) remains in the bearish territory at 41.00, suggesting more room for losses.

The overbought conditions on the daily chart combined with a bearish outside day candle created on Friday also back the case for further downside.

The XAU bulls need clearance above the bearish 21-hourly Simple Moving Average (HMA) at $2040 to regain control. However, a sustained move above the horizontal 50-HMA at $2050 is needed to revive last week’s bullish momentum for a rally towards the record highs above $2075.

Gold: Additional levels to consider

XAU/USD

Overview
Today last price2028.72
Today Daily Change-6.44
Today Daily Change %-0.32
Today daily open2035.16
 
Trends
Daily SMA201914.43
Daily SMA501815.93
Daily SMA1001750.33
Daily SMA2001642.89
 
Levels
Previous Daily High2075.32
Previous Daily Low2015.68
Previous Weekly High2075.32
Previous Weekly Low1960.67
Previous Monthly High1984.8
Previous Monthly Low1757.7
Daily Fibonacci 38.2%2038.46
Daily Fibonacci 61.8%2052.54
Daily Pivot Point S12008.79
Daily Pivot Point S21982.41
Daily Pivot Point S31949.15
Daily Pivot Point R12068.43
Daily Pivot Point R22101.69
Daily Pivot Point R32128.07

Premium

You have reached your limit of 3 free articles for this month.

Start your subscription and get access to all our original articles.

Subscribe to PremiumSign In

Author

Dhwani Mehta

Dhwani Mehta

FXStreet

Residing in Mumbai (India), Dhwani is a Senior Analyst and Manager of the Asian session at FXStreet. She has over 10 years of experience in analyzing and covering the global financial markets, with specialization in Forex and commodities markets.

More from Dhwani Mehta
Share:

Editor's Picks

AUD/USD stays bid above 0.7100 on Australian trade data, Mideast optimism

AUD/USD clings to minor recovery gains above 0.7100 in the Asian session on Thursday as a new Israel-Lebanon ceasefire keeps a lid on the safe-haven US Dollar. Meanwhile, strong AustralianTrade Balane data also help the Aussie pair sustain the bounce from weekly lows.

USD/JPY hovers near the 160.00 intervention threshold on Mideast tensions

USD/JPY struggles to find acceptance above 160.00 and retreats from a one-month high in the Asian session on Thursday amid fears that authorities will step in again to prop up the Japanese Yen. Furthermore, a new Israel-Lebanon ceasefire caps the US Dollar and supports the currency pair. However, renewed US-Iran tensions keep the downside limited in the Greenback and the pair.

Gold defends 200-day SMA; upside seems capped on Iran uncertainty

Gold recovers from a one-week low near $4,425, or the 200-day SMA, in the Asian session on Thursday, as news of an Israel-Lebanon ceasefire acts as a headwind for the safe-haven US Dollar. However, renewed hostilities in the Gulf, along with stalled US-Iran peace talks, keep geopolitical risks in play and should support the USD, checking the Gold price rebound.


Bitcoin drops below $65K amid reinforced bear market signals

Bitcoin dipped further below $65,000 on Wednesday, with onchain data from Glassnode signaling a market firmly in a bear phase. The decline has pushed prices back into a key valuation range between the Realized Price and the True Market Mean. Glassnode noted that a key shift in market structure has also emerged.

Kevin Warsh takes the Fed helm: What it means for the US Dollar
The Federal Reserve moves away from the highly predictable "forward guidance" model of the Jerome Powell era to a new “Kevin Warsh environment”, characterized by less communication, more policy surprises, and an increased focus on the Fed's complex balance sheet.
Recession on paper: What really moves the Canadian Loonie now?

Statistics Canada handed the headline writers a gift and the analysts a headache. Real GDP shrank 0.1% on an annualized basis in the first quarter, and with the fourth quarter of 2025 revised down to a 1.0% contraction, that is two negative quarters in a row, the textbook definition of a technical recession and Canada's first since the pandemic.