Gold Price Forecast: Gold could soon challenge the $1,600 level

XAUUSD Current price: $1,628.71
- US Treasury yields soared amid fears of a steepening economic downturn.
- European central banks repeated their commitments to fight inflation.
- XAUUSD presents a strongly bearish bias in a risk-averse environment.
Demand for the greenback continued at the beginning of the week, resulting in XAUUSD plummeting to $1,626.67 a troy ounce, its lowest since April 2020. Concerns about potential recessions undermined the dismal market’s mood, pushing the greenback higher despite its extreme overbought conditions.
Meanwhile, the 2-year Treasury note yield jumped to 4.351%, its highest in fifteen years, while the 10-year note yielded as much as 3.833%. The gap between yields reflects fears of an economic setback while providing additional support to the American currency. Stocks, on the other hand, trade in the red, with only the Nasdaq Composite posting a modest intraday advance.
Central banks continued to dominate the scene. The Bank of England made an unexpected announcement as the Sterling plunged to record lows against its American rival. However, Governor Andrew Bailey repeated they would not hesitate to alter interest rates as necessary to return inflation to the 2% target sustainably in the medium term, adding they are “closely monitoring” financial markets developments. Also, European Central Bank President Christine Lagarde hit the wires and said that they might need to take additional measures to deal with inflation.
Gold price short-term technical outlook
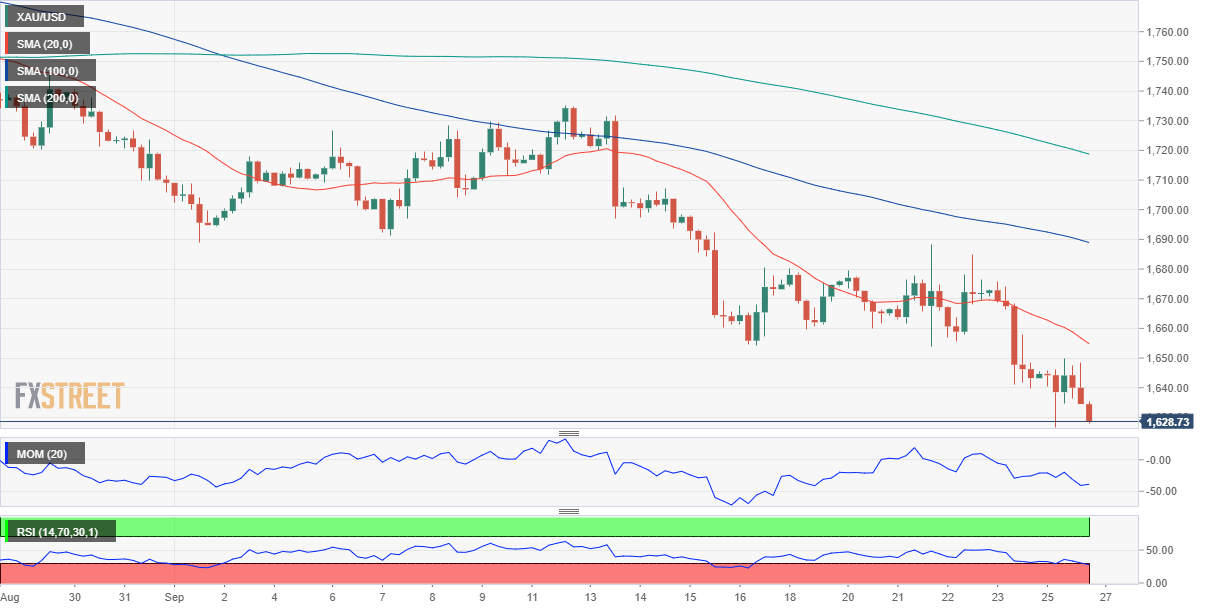
The bright metal bounced ahead of the US opening but quickly resumed its decline afterward. The daily chart for XAUUSD shows that it is currently pressuring the aforementioned multi-month low while extending its slide below firmly bearish moving averages. The 20 SMA currently stands at $1,690.50, providing relevant resistance in the unlikely case of a reversal. Technical indicators, in the meantime, remain within negative levels, with the RSI maintaining its bearish slope at around 27.
In the near term, and according to the 4-hour chart, the technical picture is quite similar, reflecting persistent selling interest. Technical indicators head south almost vertically below their midlines and, after correcting oversold conditions, reached earlier in the day. Meanwhile, the pair develops below moving averages, which maintain firmly downward slopes.
Support levels: 1,624.50 1,611.30 1,598.90
Resistance levels: 1,649.70 1,661.70 1,678.50
Premium
You have reached your limit of 3 free articles for this month.
Start your subscription and get access to all our original articles.
Author

Valeria Bednarik
FXStreet
Valeria Bednarik was born and lives in Buenos Aires, Argentina. Her passion for math and numbers pushed her into studying economics in her younger years.


