Gold Price Forecast: Fresh downside opening up for XAU/USD heading into the US PCE inflation test
- Gold price consolidates weekly losses below $3,330 early Friday, awaits US PCE inflation for fresh incentives.
- US Dollar holds rebound from multi-year lows amid US trade deals optimism and renewed hawkish Fed bets.
- Gold price battles 50-day SMA support, focus on the weekly closing amid bearish daily RSI.

Gold price is nursing weekly losses early Friday, with fresh downside risks emerging ahead of the US Personal Consumption Expenditures (PCE) Price Index data release.
Gold price eyes on US trade deal talks, PCE inflation
As the US Dollar (USD) consolidates its overnight rebound from over three-year lows, Gold price challenges a critical daily support line.
Traders refrain from placing any directional positions in the Greenback and Gold price before the release of the Fed’s preferred inflation measure, the core PCE Price Index, due later this Friday.
Markets are expecting the annual core PCE Price Index to advance by 2.3% in May, following a 2.1% growth in April, while on a monthly basis, the gauge is seen rising 0.1% in May, at the same pace as in April.
Hotter-than-expected core PCE readings could re-kindle expectations of the US Federal Reserve (Fed) lowering interest rates as early as July.
Markets are currently pricing in a 21% chance of a July Fed rate cut, while for a September reduction, the odds stand at 75%, the CME Group’s Fed WatchTool showed.
Therefore, the data will hold the key to determining the timing of the next Fed rate cut, significantly impacting the USD-denominated and non-yielding Gold price.
The USD experienced good two-way businesses, falling to the lowest level since March 2022, following the Wall Street Journal (WSJ) report that US President Trump is considering selecting and announcing a successor for Fed Chair Jerome Powell earlier by September or October.
Markets speculated that Trump’s attack threatening the Fed’s credibility could lead to the selection of a dovish successor, a so-called ‘lame duck’. This narrative weighed heavily on the buck.
However, the Greenback found its feet after a person familiar with the White House's deliberations told Reuters on Thursday, “Trump has not decided on a replacement for Powell and a decision is not imminent.”
Further, hopes of US trade deals with the European Union (EU) and China before the July 9 deadline helped the US Dollar recover earlier losses.
A WSJ report cited late Thursday that EU officials are weighing lowering tariffs on US imports to woo Trump.
Meanwhile, a White House official said that the US has reached an understanding with China on how to expedite rare earth shipments to the US.
Gold price technical analysis: Daily chart
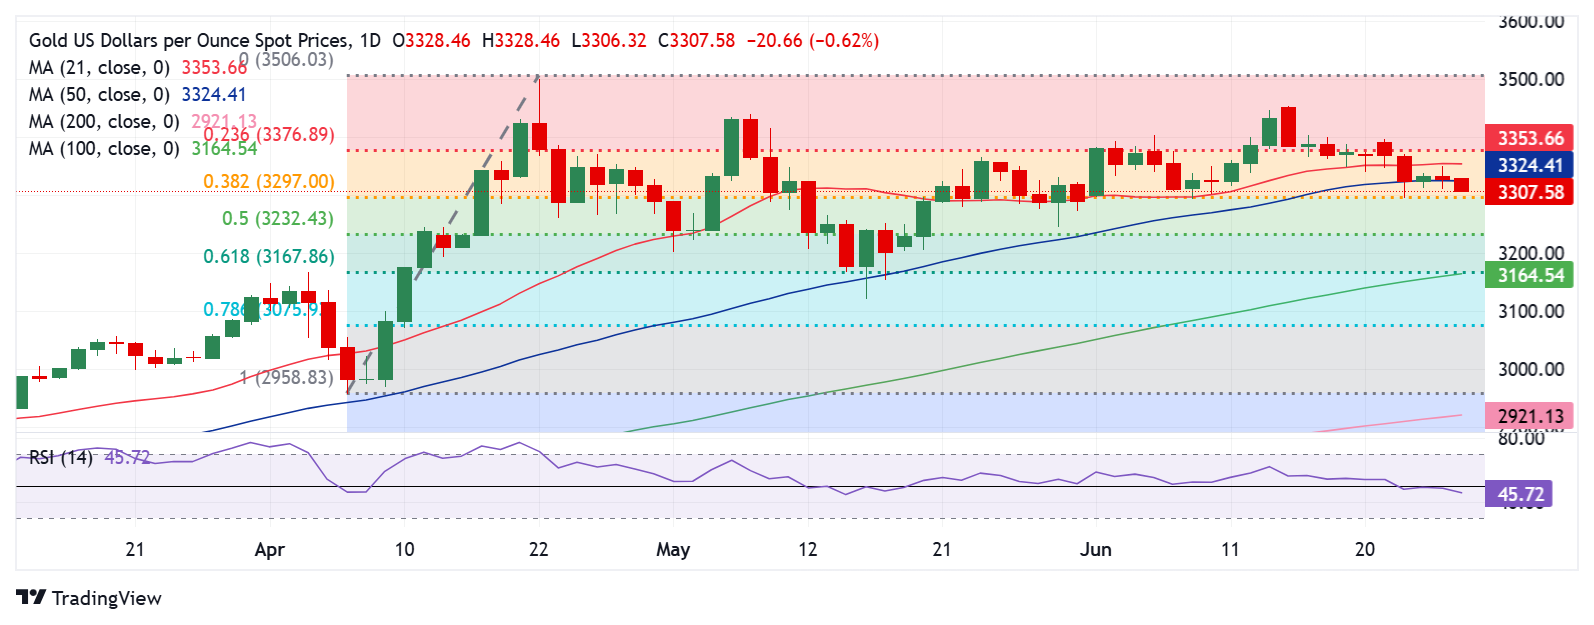
Having defended the strong support of the 50-day Simple Moving Average (SMA) at $3,325 so far this week, Gold price is yet again testing bids below that level at the press time.
The 14-day Relative Strength Index (RSI) is pointing south below the midline, currently trading near 46, suggesting that downside potential remains in place.
A weekly closing below the 50-day SMA support could validate a fresh downtrend, with the door opening for a test of the 50% Fibonacci Retracement (Fibo) level of the April record rally at $3,232.
Ahead of that, the $3,295 demand area will be retested, which is the intersection of the weekly low and the 38.2% Fibo level of the same ascent.
On the flip side, the immediate resistance is seen at the 50-day SMA, above which the 21-day SMA hurdle at $3,354 will be put to test.
Recapturing the 21-day SMA is critical for resuming the recovery from two-week troughs.
The next upside hurdle is aligned at the 23.6% Fibo level at $3,377.
Gold buyers will then target the $3,400 threshold once the 23.6% Fibo resistance is decisively taken out.
(This story was corrected on June 27 at 7GMT to say that "as the US Dollar (USD) consolidates its overnight rebound from over three-year lows," not highs.)
Economic Indicator
Core Personal Consumption Expenditures - Price Index (YoY)
The Core Personal Consumption Expenditures (PCE), released by the US Bureau of Economic Analysis on a monthly basis, measures the changes in the prices of goods and services purchased by consumers in the United States (US). The PCE Price Index is also the Federal Reserve’s (Fed) preferred gauge of inflation. The YoY reading compares the prices of goods in the reference month to the same month a year earlier. The core reading excludes the so-called more volatile food and energy components to give a more accurate measurement of price pressures." Generally, a high reading is bullish for the US Dollar (USD), while a low reading is bearish.
Read more.Next release: Fri Jun 27, 2025 12:30
Frequency: Monthly
Consensus: 2.6%
Previous: 2.5%
Source: US Bureau of Economic Analysis
After publishing the GDP report, the US Bureau of Economic Analysis releases the Personal Consumption Expenditures (PCE) Price Index data alongside the monthly changes in Personal Spending and Personal Income. FOMC policymakers use the annual Core PCE Price Index, which excludes volatile food and energy prices, as their primary gauge of inflation. A stronger-than-expected reading could help the USD outperform its rivals as it would hint at a possible hawkish shift in the Fed’s forward guidance and vice versa.
Premium
You have reached your limit of 3 free articles for this month.
Start your subscription and get access to all our original articles.
Author

Dhwani Mehta
FXStreet
Residing in Mumbai (India), Dhwani is a Senior Analyst and Manager of the Asian session at FXStreet. She has over 10 years of experience in analyzing and covering the global financial markets, with specialization in Forex and commodities markets.


