Gold Price Forecast: Fed's wording could make or break the yellow metal

Gold (XAU/USD) fell to $1,309.65 today, its lowest level since March 1 and is set to close at two-week low of $1,313.
The 0.75 percent week-on-week drop could be attributed to USD strength. The greenback has picked up a bid on fears Powell and Co. may revise the dot plot chart to four rate hikes this year.
Gold likely to remain under pressure ahead of the Fed
The rise in the USD is backed by widening of the bond yield spreads in the USD-positive manner. The two-year yield rose to 2.299 percent - the highest since September 2008. Clearly, the traditional FX market correlations are being re-established.
Further, the dollar funding cost is rising at a faster rate. The spread between the three-month dollar London interbank offered rate (LIBOR) and three-month overnight indexed swap rate (OIS) rose well above 50.00 basis points - a level not seen since January 2012. At the end of 2017, it was 27.83 basis points.
The action in the rates market indicates the investors are seriously considering the increased possibility of faster Fed tightening. Hence, the yellow metal will likely remain under pressure and could break below $1,300 (if fears of hawkish Fed grip markets) ahead of the next Wednesday's Fed decision.
Focus on Fed's wording
A 25 basis point rate hike has been priced-in. In fact, a total of three rate hikes this year isn't a news anymore. That said, investors will be paying close attention to the wording of the Fed statement for clues on whether Fed, under Powell's leadership, believes the current conditions warrant faster rate hikes (four rate hikes this year) and its opinion on trade wars.
The bar of expectations has been set high
Scenario I* - As noted above, the investors are preparing for a hawkish tone. So, the bar of expectations has been set high. If the Fed disappoints, the USD will most probably sink, pushing the yellow metal higher.
Scenario II* - On the other hand, the yellow metal will likely suffer moderate losses if the Fed revises higher its dot plot to four rate hikes this year, as expected. Also, "Buy the fact" trade could see yield quick recovery in prices.
Scenario III* - There is a third scenario, which could inflict maximum damage to gold bulls. The Fed may express concerns about the inflationary impact of global trade wars, in which case the markets will likely start pricing-in five rate hikes this year.
Gold daily chart
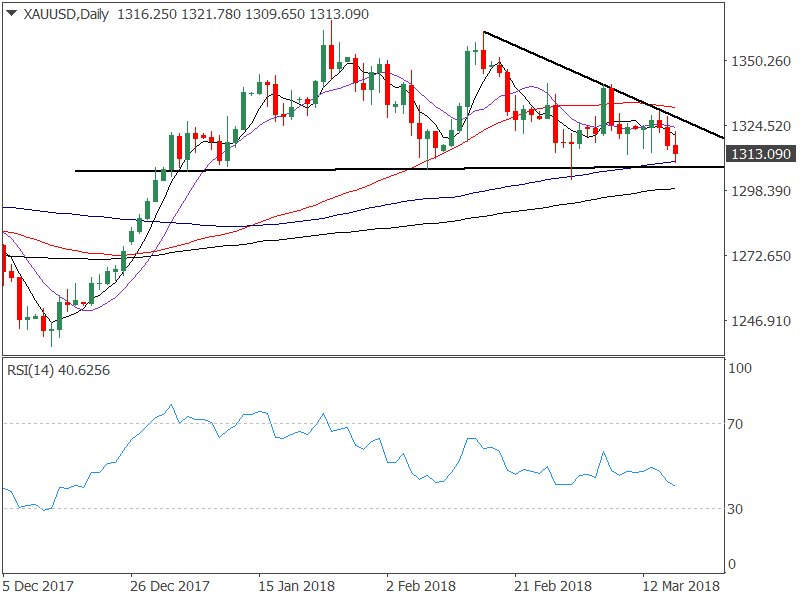
The above chart shows-
- Bulls failed to capitalize on the "long-tailed" bullish doji reversal confirmed on March 2. Prices turned lower from $1,340 (March 7 high) and fell to a two-week low of $1,309.65 today, thus creating a lower high pattern on the daily chart (as represented by the descending trendline).
- The 5-day moving average (MA) and the 10-day MA is biased bearish.
- The 50-day MA has topped out.
- The relative strength index (RSI) has rolled over in favor of the bears.
Weekly chart
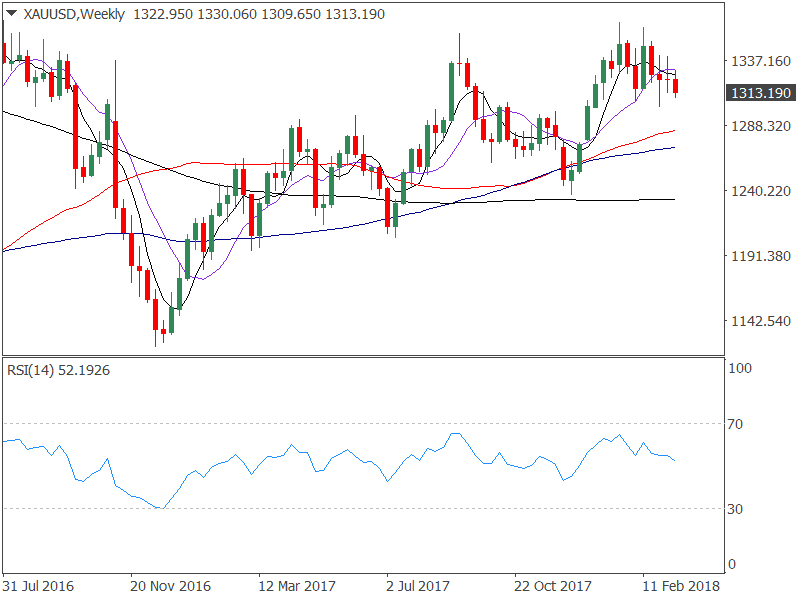
- Bearish doji reversal (last week's doji and bearish follow-through this week) indicates the bears have regained control and could push the yellow metal below the $1,300 mark.
View
- Prices may drop to or below $1,300, the daily chart indicates. In a larger scheme of things, only a weekly close above $1,330 would revive the bullish outlook.
- Scenario I* - Bottom pickers' dream... the metal will likely revisit $1,250 in the subsequent days.
- Scenario II* - Buy the fact... the metal could find takers, but reckon the 50-day MA resistance would hold.
- Scenario III* - The metal could drop below $1,272 (weekly 100-MA).
Author

Omkar Godbole
FXStreet Contributor
Omkar Godbole, editor and analyst, joined FXStreet after four years as a research analyst at several Indian brokerage companies.


