Gold Price Forecast: Defending $1,915 is critical for XAU/USD after hawkish Fed minutes
- Gold price displays a choppy trend, within a familiar range so far this week.
- Hawkish Fed minutes keep the downside compelling for gold price.
- Gold bears look to retest the $1,915 key support amid bearish RSI on the 4H.

Gold price meandered near the lower bound of this week’s trading on Wednesday, extending its choppy trend between the $1,940-$1,915 price range. Gold traders struggled to find a clear direction despite the hawkish FOMC March meeting’s minutes, leaving the bright metal almost unchanged on the day near the $1,925 area.
The Fed minutes revealed that the board member outlined plans to reduce the balance sheet by more than $1 trillion a year while hiking interest rates, hinting at commencing the balance sheet run-off as early as next month.
The US Treasury yields soared to fresh multi-year highs, underpinning the US dollar’s strength, which downed gold price to retest the daily lows of $1,915. Meanwhile, the tech and real estate stocks on Wall Street tanked on fresh concerns over the aggressive Fed’s tightening plans and the resultant higher borrowing costs. The US stocks sell-off fuelled risk-off trading helped provide a floor to the safe-haven gold price. Further, fresh Western sanctions against the Russian killings of the Ukrainian civilians also lend support to the yellow metal.
Also read: Gold Price looks south towards $1,915 despite retreating Treasury yields.
Was the gold price reaction to the hawkish Fed minutes temporary? Doesn’t seem so, as XAUUSD is looking to extend the downside this Thursday, despite the pullback in the US Treasury yields and the dollar. Risk-off sentiment remains in full swing heading into European trading amid new Russian sanctions and the Fed’s hawkishness. Traders also remain cautious ahead of a barrage of Fed speakers due on the docket, which could reinforce the bearish interests around gold price.
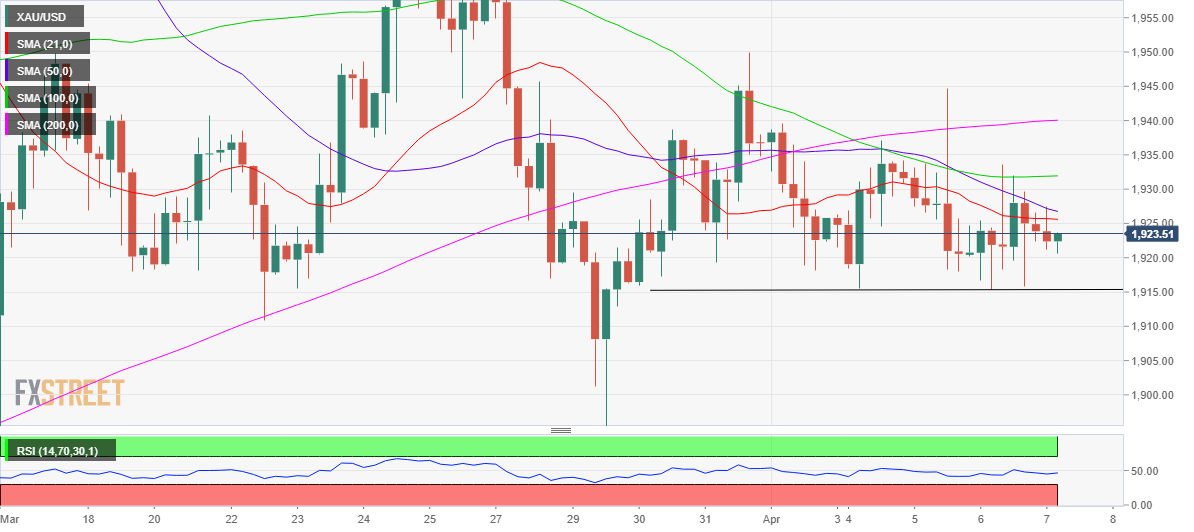
Gold: Four-hour chart
Gold’s daily chart shows that the price remains poised to test the horizontal trendline resistance near the $1,915 region.
A sustained break below the latter will expose the $1,900 round figure. The last line of defense for bulls is seen at the March 29 low of $1,890.
The Relative Strength Index (RSI) remains below the midline, backing the bearish view on the metal.
On the upside, the confluence of the 21 and 50-Simple Moving Averages (SMA) around $1,926 will offer immediate resistance.
The horizontal 100-SMA at $1,931 is likely to guard the additional upside en-route the $1,940 barrier.
Premium
You have reached your limit of 3 free articles for this month.
Start your subscription and get access to all our original articles.
Author

Dhwani Mehta
FXStreet
Residing in Mumbai (India), Dhwani is a Senior Analyst and Manager of the Asian session at FXStreet. She has over 10 years of experience in analyzing and covering the global financial markets, with specialization in Forex and commodities markets.


