Gold Price Forecast: Bulls in charge and still aiming for $1,900

XAU/USD Current price: $1,863.29
- US Treasury yields advancing amid a worsening market’s mood.
- ECB President Lagarde reiterated that it is no time to tighten the monetary policy.
- XAU/USD holds on to gains near a fresh multi-month high of 1,870.48.
Gold consolidates gains in the $1,860 price zone, marginally lower on a daily basis, although after reaching a fresh multi-month high earlier in the day. XAU/USD hit 1,870.48 during London trading hours, as the greenback shed ground on the heels of a better market mood. Chinese data released at the beginning of the day was upbeat, helping to ease growth-related concerns.
Subdued yields changed course after Wall Street’s opening, with that on the 10-year US Treasury note jumping to 1.61%, while at the same time, US indexes trimmed pre-opening gains and currently struggle around their midlines. Gold recovered from its intraday low as the sentiment took a turn to the worst.
Investors are still eyeing inflation levels and central banks monetary policies’ decisions for direction. On Monday, European Central Bank President Christine Lagarde said that any tightening measure now would cause more harm than good to the economy, highlighting the imbalances with the US Federal Reserve. The week will be light in macroeconomic releases, which means speculative interest will keep an eye on stocks and yields for direction.
Gold price short-term technical outlook
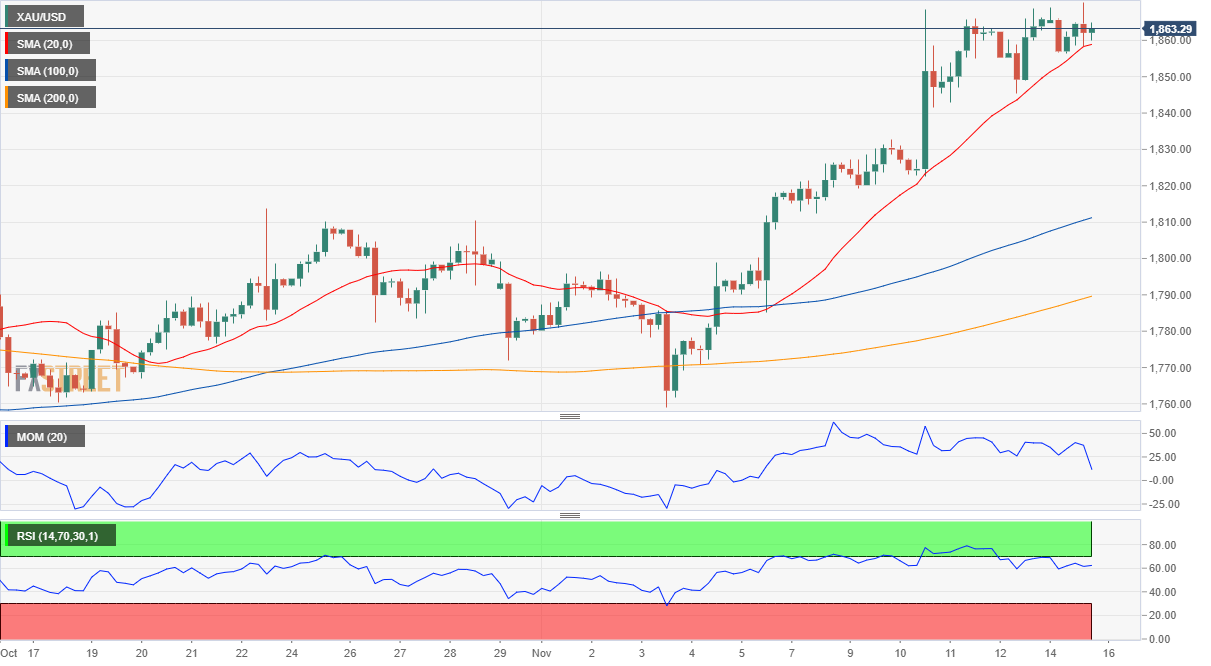
XAU/USD has posted a higher high and a higher low on a daily basis, a sign that bulls retain the lead, despite currently being down. The daily chart shows that the bright metal keeps developing above all of its moving averages, with the 20 SMA gaining bullish traction above the longer ones. At the same time, technical indicators consolidate within overbought levels with modest upward slopes, in line with the dominant bullish trend.
The 4-hour chart shows that buyers are defending the downside on approaches to a bullish 20 SMA, which provides intraday support and currently stands at 1,858.10. The Momentum indicator heads south near its midline, reflecting the absence of follow-through beyond the 1,870 price zone, while the RSI indicator consolidates around 60.
Support levels: 1,858.10 1,845.20 1,837.50
Resistance levels: 1,870.10 4 1,883.00 1,895.20
Premium
You have reached your limit of 3 free articles for this month.
Start your subscription and get access to all our original articles.
Author

Valeria Bednarik
FXStreet
Valeria Bednarik was born and lives in Buenos Aires, Argentina. Her passion for math and numbers pushed her into studying economics in her younger years.


