Gold Price Forecast: Bulls challenging Fibonacci resistance

XAU/USD Current price: $1,765.01
- Gold prices recovered sharply as investors rush into safety on equities slump.
- Market participants focused on US employment data, waiting for the Nonfarm Payrolls report.
- XAU/USD is poised to extend its advance in the near term, eyeing 1,777.75 resistance.
Spot gold up roared following a dismal Wall Street opening and trades at its highest in over a week near a daily high of $1,770.57 a troy ounce. Demand for the safe-haven metal is inversely proportional to the equities slide, as US indexes trade with sharp losses. Market participants are concerned about Chinese financial stability, as Evergrande make it again to the highlights. The company halted trading during Asian trading hours, and there was later news indicating it would sell a stake in its property management business for more than US$5 billion. Worth noting that the company accumulates a US$305 billion debt.
At the same time, demand for the American currency receded on the back of lower US government bond yields. After Friday’s slide, the yield on the 10-year Treasury note held below the 1.50% threshold, currently hovering around 1.47%.
Investors are waiting for US employment data, as the numbers could be a game-changer. US Federal Reserve chief Jerome Powell has said that one good employment report would be enough to convince him it’s time for tapering. Ahead of the Nonfarm Payrolls report to be out on Friday, the country will publish the ADP survey and the usual weekly unemployment figures.
Gold price short-term technical outlook
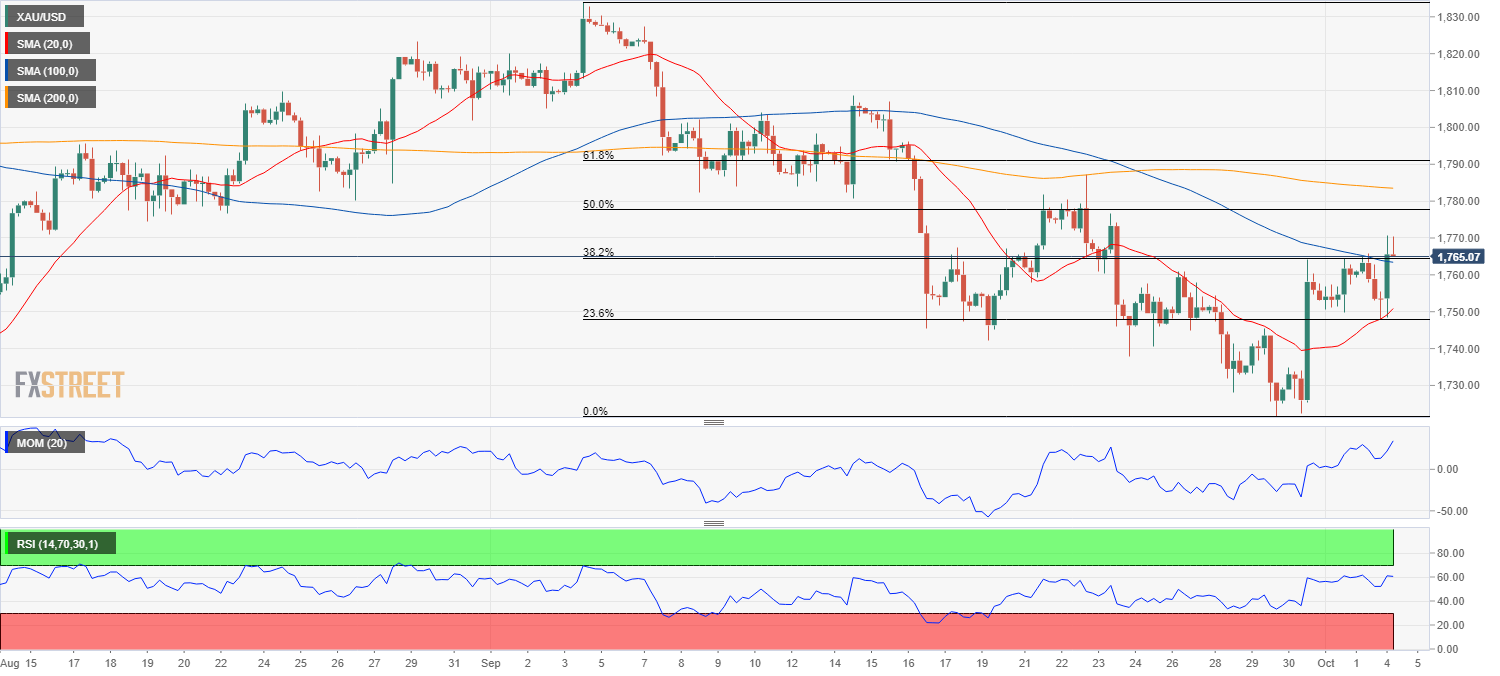
XAU/USD trades just above the 38.2% retracement of its latest daily slump, and the daily chart indicates that further gains are still in doubt. The bright metal stalled just below a bearish 20 SMA, while technical indicators have turned flat within negative levels. A daily close above 1,765.35, a Fibonacci level, should favor a bullish extension in the upcoming sessions.
The 4-hour chart shows that gold has bounced from a bullish 20 SMA, while it’s currently overcoming a bearish 100 SMA. Technical indicators have resumed their advances within positive levels, indicating persistent buying interest.
Support levels: 1,764.35 1,748.05 1,735.26
Resistance levels: 1,777.75 1,787.30 1,798.50
Premium
You have reached your limit of 3 free articles for this month.
Start your subscription and get access to all our original articles.
Author

Valeria Bednarik
FXStreet
Valeria Bednarik was born and lives in Buenos Aires, Argentina. Her passion for math and numbers pushed her into studying economics in her younger years.


