• Gold awaits bullish breakout.
  • Technical charts show breakout is overdue.

Elvis Presley's "so close, yet so far from paradise" best describes the situation in the gold market.

The technical and fundamental factors are biased bullish, still for some odd reason, the yellow metal continues to have a tough time crossing the all-important resistance zone of $1,350 to $1,380.

Daily chart

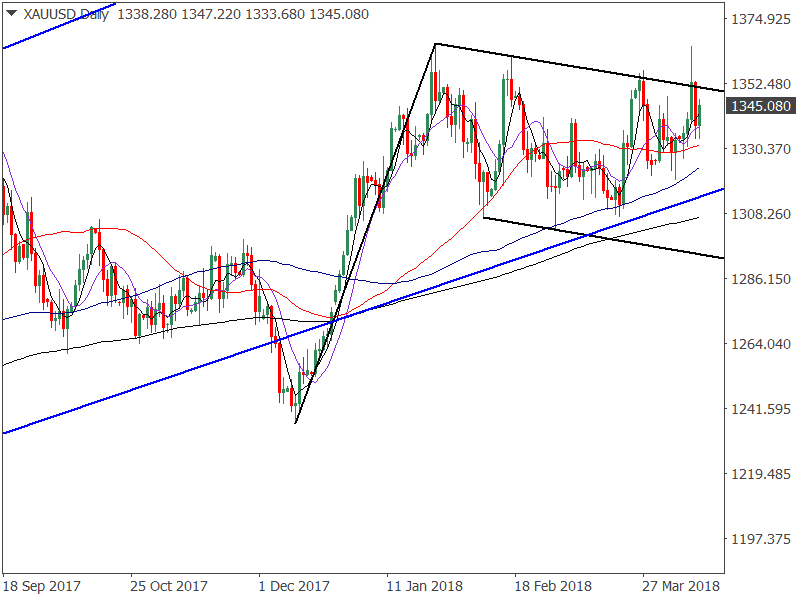
The yellow metal witnessed a bull flag breakout on Wednesday, opening the doors for a rally to $1,466 (target as per the measured height method). But, prices fell back to $1,333 the very next day, pouring cold water over the optimism.

Since January, gold has failed four times to hold on to gains above the $1,350 mark. Also, gold's Brexit referendum rally had run out of steam near $1,379 - 38.2 percent Fibonacci retracement of the drop from 2011 high to 2015 low.

Still, despite the "bull flag fakeout", the technical outlook remains bullish as indicated by the momentum studies: 5,10, 21 MAs (moving average) are trending north, indicating bullish setup. The 50,100 and 200-day MAs are aligned in favor of a bullish move.

Weekly chart

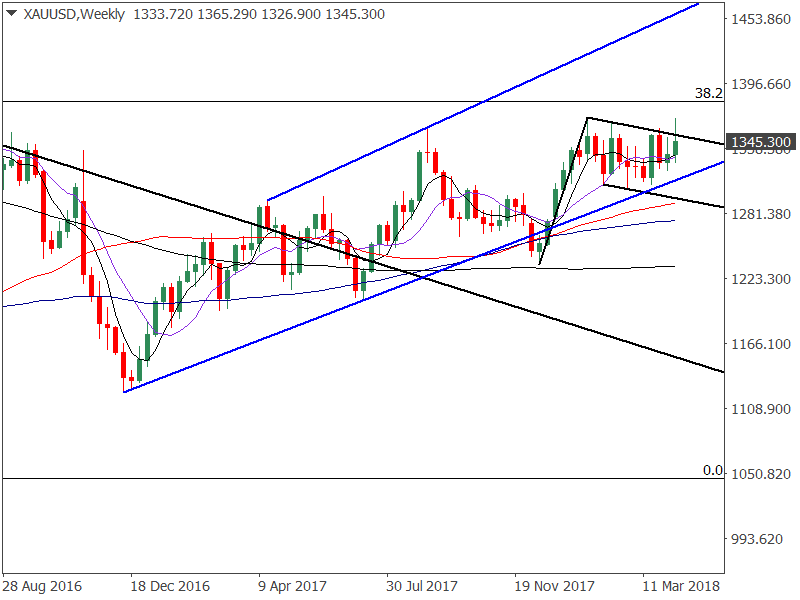
The weekly chart shows a big rounding bottom pattern, a rising channel (representing higher highs and higher lows) and a bull flag. The moving averages - 5,10, 50, 100 and 200 are biased bullish.

Further,  the weakness in stocks, US-China trade tensions, and geopolitical tensions are all gold positive. Clearly, the technical and fundamental factors call for a much higher gold price... So, the breakout is so close, yet so far.

That said, the post-breakout move will likely be violent... a near 90-degree rally towards $1,481 (50 percent Fibonacci retracement of the drop from 2011 high to 2015 low) could unfold in a couple of weeks, given the breakout has remained elusive for almost two years now.

A bull flag breakout on the weekly chart (as per weekly closing) will likely set the tone for a rally to $1,480-$1,500.

On the downside, acceptance below $1,300 would add credence to repeated rejection in the $1,350-$1,380 range and would shift risk in favor of a sustained drop to $1,250-$1,240.

Information on these pages contains forward-looking statements that involve risks and uncertainties. Markets and instruments profiled on this page are for informational purposes only and should not in any way come across as a recommendation to buy or sell in these assets. You should do your own thorough research before making any investment decisions. FXStreet does not in any way guarantee that this information is free from mistakes, errors, or material misstatements. It also does not guarantee that this information is of a timely nature. Investing in Open Markets involves a great deal of risk, including the loss of all or a portion of your investment, as well as emotional distress. All risks, losses and costs associated with investing, including total loss of principal, are your responsibility. The views and opinions expressed in this article are those of the authors and do not necessarily reflect the official policy or position of FXStreet nor its advertisers. The author will not be held responsible for information that is found at the end of links posted on this page.

If not otherwise explicitly mentioned in the body of the article, at the time of writing, the author has no position in any stock mentioned in this article and no business relationship with any company mentioned. The author has not received compensation for writing this article, other than from FXStreet.

FXStreet and the author do not provide personalized recommendations. The author makes no representations as to the accuracy, completeness, or suitability of this information. FXStreet and the author will not be liable for any errors, omissions or any losses, injuries or damages arising from this information and its display or use. Errors and omissions excepted.

The author and FXStreet are not registered investment advisors and nothing in this article is intended to be investment advice.

Recommended Content


Recommended Content

Editors’ Picks

EUR/USD clings to daily gains above 1.0650

EUR/USD clings to daily gains above 1.0650

EUR/USD gained traction and turned positive on the day above 1.0650. The improvement seen in risk mood following the earlier flight to safety weighs on the US Dollar ahead of the weekend and helps the pair push higher.

EUR/USD News

GBP/USD recovers toward 1.2450 after UK Retail Sales data

GBP/USD recovers toward 1.2450 after UK Retail Sales data

GBP/USD reversed its direction and advanced to the 1.2450 area after touching a fresh multi-month low below 1.2400 in the Asian session. The positive shift seen in risk mood on easing fears over a deepening Iran-Israel conflict supports the pair.

GBP/USD News

Gold holds steady at around $2,380 following earlier spike

Gold holds steady at around $2,380 following earlier spike

Gold stabilized near $2,380 after spiking above $2,400 with the immediate reaction to reports of Israel striking Iran. Meanwhile, the pullback seen in the US Treasury bond yields helps XAU/USD hold its ground.

Gold News

Bitcoin Weekly Forecast: BTC post-halving rally could be partially priced in Premium

Bitcoin Weekly Forecast: BTC post-halving rally could be partially priced in

Bitcoin price shows no signs of directional bias while it holds above  $60,000. The fourth BTC halving is partially priced in, according to Deutsche Bank’s research. 

Read more

Geopolitics once again take centre stage, as UK Retail Sales wither

Geopolitics once again take centre stage, as UK Retail Sales wither

Nearly a week to the day when Iran sent drones and missiles into Israel, Israel has retaliated and sent a missile into Iran. The initial reports caused a large uptick in the oil price.

Read more

Majors

Cryptocurrencies

Signatures