Gold Price Forecast: 3 scenarios that could define the rest of 2026
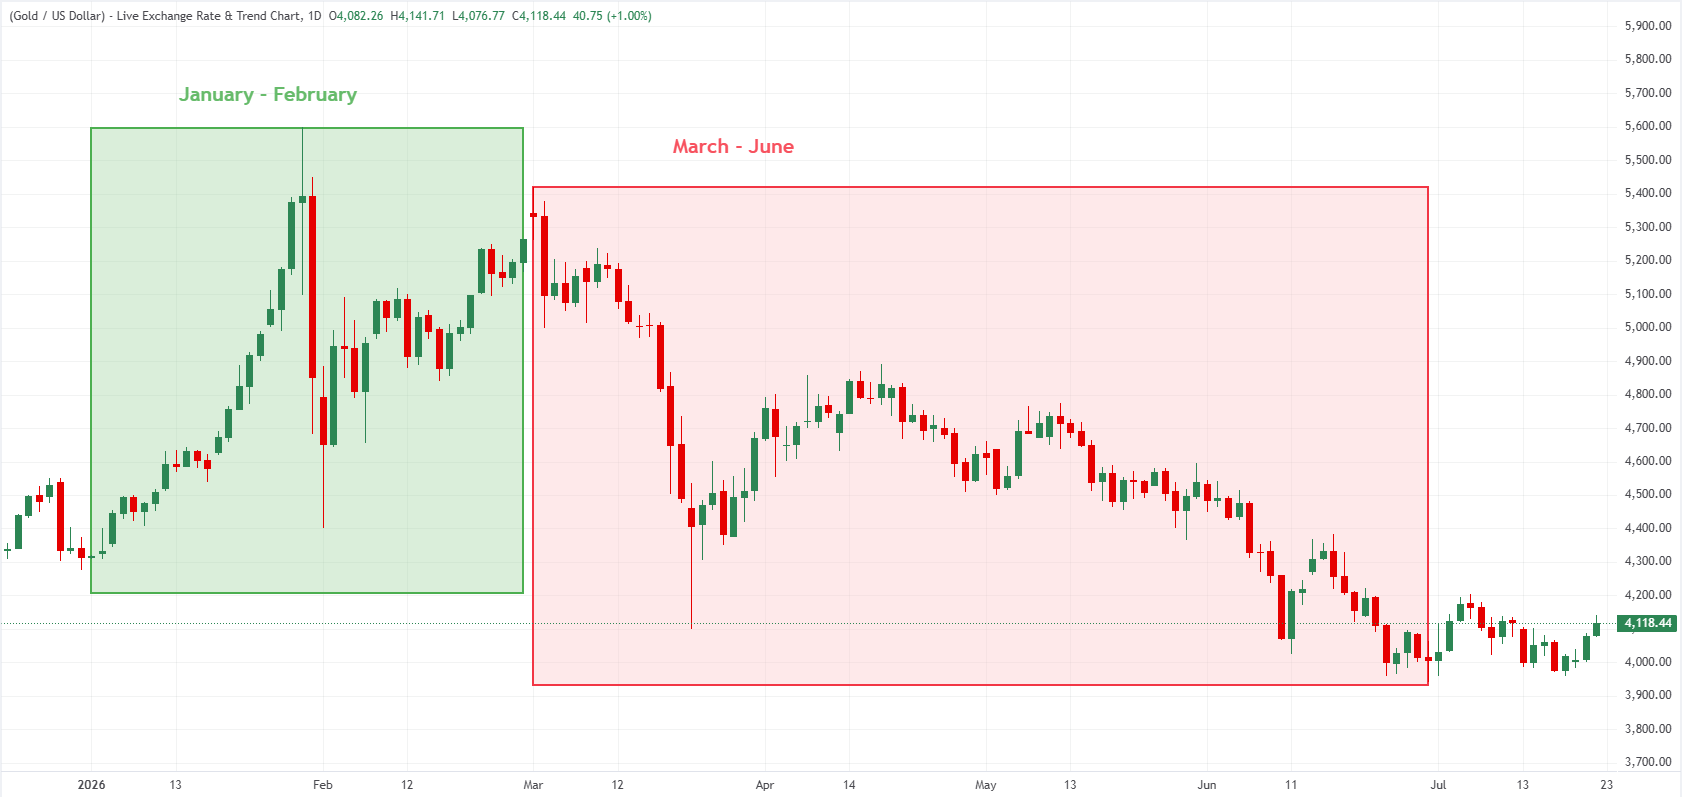
Gold (XAU/USD) delivered a masterclass in volatility in the first half of the year, rising more than 20% in the January-February period before entering a downtrend that saw the precious metal lose nearly 30% from March to the end of the second quarter. As the second half of the year begins, Gold’s next major move could spark a powerful comeback or push the metal toward its worst annual performance since 2013.
Why Gold lost its safe haven status
Gold started the year on a bullish note and set a new record-high near $5,600 in late January.
Growing expectations for a dovish Federal Reserve (Fed) policy outlook, with Kevin Warsh becoming the front-runner to replace Chairman Jerome Powell, weighed on United States (US) Treasury bond yields and the US Dollar (USD), fuelling Gold’s rally.
Additionally, escalating tensions in the Middle East, with the US threatening military intervention in Iran following severe domestic crackdowns on protestors and failed diplomatic efforts regarding Iran’s ballistic programme, allowed Gold to find demand as a traditional safe-haven.
By the final trading day of January, Gold declined sharply but still gained about 13% for the month. The confirmation of Warsh’s nomination triggered a “buy the rumor, sell the fact” action, while investors also realized that Warsh was in favor of strict monetary discipline and that he was unlikely to become a “yes-man” for US President Donald Trump, who insisted on the Fed to cut interest rates.
Still, Gold preserved its bullish momentum in February as the latest decline drew renewed interest, especially from institutional buyers. “Global physically backed Gold ETFs registered another month of inflows in February, adding US$5.3 billion – the strongest two-month start to a year and the ninth consecutive monthly increase, as investors continued to build allocations amid elevated geopolitical risk and shifting macro conditions,” the World Gold Council (WGC) noted in its monthly report for February.
However, things changed drastically when Israel and the US carried out a joint military operation against Iran on February 28.
Gold quickly lost its “safe-haven” status and turned south, as surging crude Oil prices fed into inflation fears. After losing nearly 12% in March, Gold stabilized but still registered marginal losses in April and May. The announcement of a temporary two-week ceasefire between the US and Iran in early April, then the extension of this ceasefire indefinitely, helped Gold keep its footing.
Although the US and Iran signed a Memorandum of Understanding (MoU) to establish a 60-day ceasefire and reopen the Strait of Hormuz fully on June 17, Gold remained under heavy bearish pressure and lost nearly 12% in June. Strong inflation readings and upbeat labor market data from the US, combined with new Fed Chair Kevin Warsh’s clear message that they will prioritize taming inflation, attracted bets for the US central bank to raise rates and dragged XAU/USD to a fresh 2026-low below $4,000.
Three scenarios for Gold and what to look at in the second half of 2026
The first half of the year showed that Gold’s declaration of its geopolitical premium has left it entirely exposed to raw macroeconomic forces. Hence, navigating the second half of the year will require a close examination of inflation dynamics and how they could influence the policy outlook of major central banks, while assessing how institutional interest could support prices.
The bullish case for Gold
For Gold to rally in the remainder of the year, the market theme needs to go through a noticeable shift. June’s action showed that a sharp decline in Oil prices might not be enough to boost Gold. There has to be a convincing dovish shift in major central banks’ policy outlook, especially the Fed, to fuel a steady uptrend in the precious metal.
The first condition that needs to be met is that there has to be a permanent end to the conflict in the Middle East. Although many experts think that it will take some time for energy supply to be restored to pre-war levels, markets will be relieved knowing that a strong increase in Oil prices is unlikely.
Peace needs to be followed by consecutive months of favorable inflation readings from the US. Once Fed officials start voicing their confidence in inflation returning toward their target of 2%, markets could move away from pricing in a rate hike and even consider a rate cut in early 2027. In this scenario, Gold could benefit from falling US T-bond yields and the renewed USD weakness.
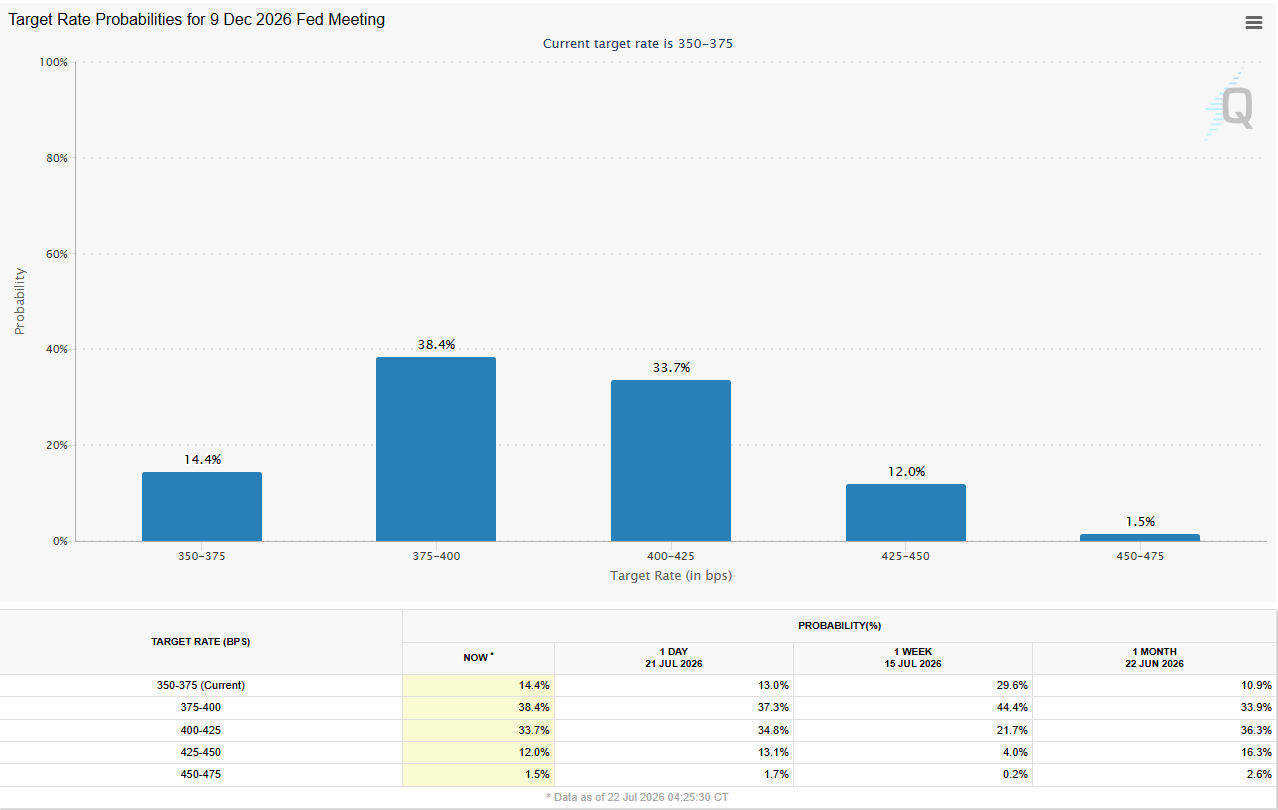
According to the CME FedWatch Tool, markets are currently pricing in about an 85% probability that the Fed will raise its policy rate by at least 25 basis points (bps) by end-2026.
One other risk event that could help Gold rise is the upcoming mid-term election in the US. There is a strong possibility that there could be a split Congress, with Democrats regaining the control of the House. It is difficult to draw a clear connection between Gold’s performance and past US mid-term election results. However, this time around Gold could benefit from political uncertainty in the US, as it’s likely to make Treasury bonds and the USD less attractive.
The bearish case for Gold
Gold could continue to suffer losses if upside risks to inflation remain in place. A prolonged conflict in the Middle East, with energy prices rising again heading into fall and winter months would be a nightmare scenario for Gold.
In this case, the Fed is likely to reaffirm its hawkish stance and possibly opt for multiple rate hikes. A robust US economy and a healthy labor market would further support the case for a hawkish policy outlook and put additional weight on the bullion’s shoulders.
Even if there is a pullback in crude Oil prices, the inflation story might not be over, thanks to the price pressures fuelled by the Artificial Intelligence boom.
In a speech delivered in July, Fed Governor Lisa Cook explicitly detailed this exact phenomenon.
"Rising core goods prices underscore the fact that the recent acceleration in inflation is not only an energy price story,” Cook said and explained that the other shock is “increased capital expenditures tied to the buildout of AI infrastructure.”
“This spending has caused significant price increases for chips, other high-tech equipment, software, and utilities. Both of these new developments add weight to the inflation risk side of the seesaw, which is now tilting toward the ground. As a whole, I see a notable shift in the balance of risks relative to a year or so ago, with inflation risks now outweighing employment risks,” she added.
In this bearish scenario, it is difficult to say how much room Gold has on the downside. Regardless of the Fed’s policy outlook or global inflation dynamics, Gold could still remain as an attractive asset, especially at lower prices, for institutional buyers and central banks.
“The Gold market has benefited from various structural shifts over the past two decades, including growth in emerging markets, the advent of gold ETFs, an increase in tail risk events, and central bank demand,” the WGC noted in its mid-year outlook report.
“More recently, sovereign wealth funds, pension funds, and endowments, and other long-term asset owners have also been increasing their participation. Last year, a pilot programme in China enabled some of the top insurance companies to invest in Gold,” authors Juan Carlos Artigas, Taylor Burnette and Dr. Fergal O'Connor noted, adding that these types of contributions from “buy-and-hold investors” could provide support for the precious metal in the second half of 2026.
The neutral case for Gold
This final scenario is a mix of the bullish and bearish conditions for Gold. Inflation in the US could remain sticky but stable, while economic conditions show signs of cooling down, causing the Fed to opt for an extended pause in the policy. While this might not be necessarily a positive development for Gold, it could cap the USD’s upside potential and allow XAU/USD to keep its footing.
There might not be an official permanent truce in the Middle East but tensions could de-escalate with sides agreeing on short-term ceasefires and trying their hand on diplomacy rather than military aggression. This situation might limit Oil’s downside but it could also ease concerns over energy costs rising uncontrollably. As a result, investors could refrain from forecasting a steady decline in inflation, capping Gold’s headroom.
My take
While all three scenarios are plausible, I find it difficult to justify another significant decline in Gold prices in the near term because I think long-term buyers are likely to step in as soon as the price comes down noticeably, between 5% and 10%.
In 2013, Gold lost nearly 30% as central bank buying failed to support the price as it was concentrated among just a few heavy hitters, such as Russia and China. According to the WGC data, total net central bank purchases in 2013 was 368.6 tonnes, compared to 244 tonnes in the first quarter of 2026 alone.
In an interview with Reuters in March, Shaokai Fan, Global Head of Central Banks at the WGC, said that central banks from Guatemala, Indonesia and Malaysia have all bought Gold in recent months, “either following a long hiatus or for the first time ever.”
“A phenomenon we've been seeing in the last few months is new central banks, or central banks that have been inactive or absent from the gold market for a long time, entering the gold market," Fan said and added that he thinks that this might be a trend that will continue in 2026.
Since a bearish scenario is relatively less likely, Gold could either stay in a consolidation phase or stage a rebound in the second half of the year. Political uncertainty in the US, easing fears over inflation getting out of control and the Fed straying away from a hawkish stance could scare the bears away.
Gold technical outlook: Bearish bias holds
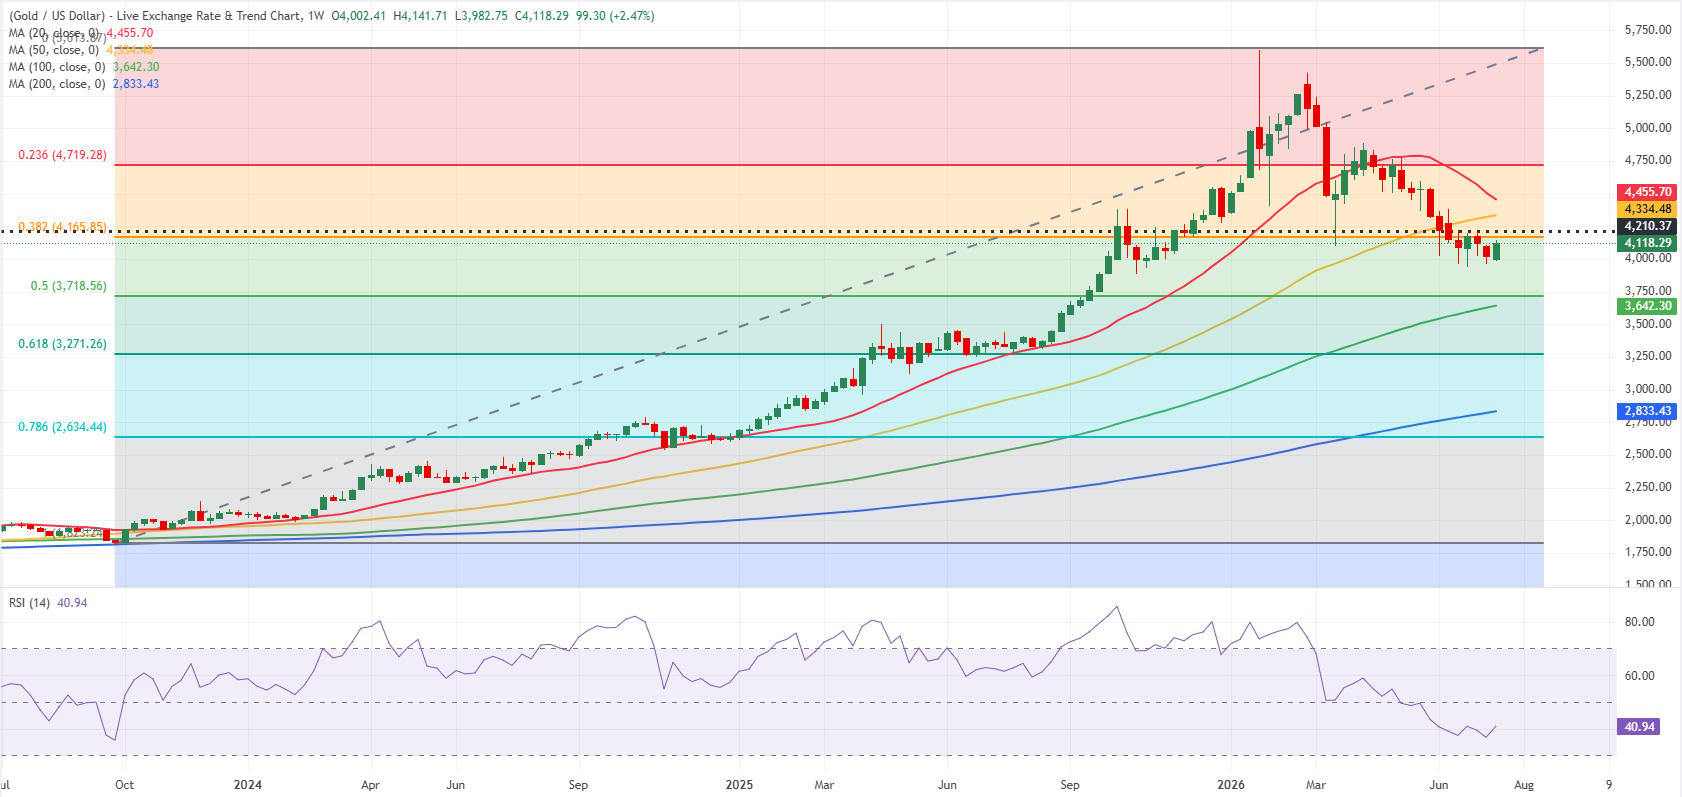
While fundamentals don’t point to further significant declines ahead, from a technical perspective, Gold remains bearish in the medium-term. The Relative Strength Index (RSI) indicator on the weekly chart sits near 40 after having touched its lowest level since late-2023 below this level, while Gold trades below 20-week and 50-week Simple Moving Averages (SMA), as well as the Fibonacci 38.2% retracement of the uptrend drawn from October-2023 to the record-high set in January.
On the downside, $3,710-$3,640 aligns as a key support area, where the Fibonacci 50% retracement and the 100-week SMA align. If this support fails, the next line of defense could be seen at $3,260 (Fibonacci 61.8% retracement) ahead of $3,000 (psychological level, round level).
In case Gold stabilizes above $4,170-$4,200 (Fibonacci 38.2% retracement, static level) in the near term, $4,330-$4,450 (50-week SMA, 20-week SMA) comes as the next resistance area. With a break above this hurdle, $4,710 (Fibonacci 23.6% retracement) could act as the next supply zone before Gold can target a new record-high above $5,600.
What analysts say
Silver and Gold positioning seen under pressure as Fed hike risks build
According to TD Securities, the backdrop of rising energy costs is set to weigh on precious metals positioning in the near term. The bank notes that “with the energy complex likely driving aggregate prices higher in the coming months, the market is increasingly pricing a Fed hike towards the end of the year,” a shift that tightens the policy outlook and raises the carry cost of holding non-yielding assets.
In this environment, TD Securities highlights that “money managers have also reduced their long silver exposure, which will apply downward pressure on prices due to weakening industrial and investment demand.” The strategists add that “as such, both silver and gold length are likely to erode for now,” underscoring a cautious stance on speculative positioning across the precious metals space.
Gold outlook hinges on Fed shift as FOMC debate intensifies
According to Commerzbank, the near-term trajectory for Gold remains closely tied to how investors reassess the Federal Reserve’s policy stance rather than to geopolitical developments alone. The bank argues that “a correction, regardless of developments in the US-Iran conflict, is likely to occur only if the market's assessment of the Federal Reserve were to fundamentally change.”
Commerzbank notes that any such shift would likely stem from evolving views within the FOMC on the necessity of further tightening. “If this view gains traction within the FOMC, it could mean that interest rate hikes are not considered necessary to combat current inflation,” the bank writes. In that scenario, Gold could draw support on multiple fronts: “The price of gold would then likely benefit not only in the short term from the market pricing out interest rate hikes, but also from the fact that the market perceives increased inflation risks in the long term due to a significantly more dovish stance by the Federal Reserve.”
Reserve managers edge away from the Dollar as Gold demand climbs
Analysts at BNY Mellon observe that reserve managers are beginning to adjust their currency allocations, noting that “reserve managers are starting to trim their Dollar exposure, but only cautiously.” In their view, “gold is the clearest beneficiary, with geopolitical risk and diversification driving demand,” and they highlight that “82% of central banks now hold physical gold.” Overall, BNY Mellon judges that the shift away from the Dollar remains measured rather than abrupt, with “de-dollarization” looking “more gradual than decisive”: “reluctant alternatives” are emerging, but a true “good alternative” is still not here.
OCBC trims precious metals outlook as higher real yields and firm USD weigh
Analysts at OCBC have turned more cautious on the precious metals complex, noting that “gold and silver forecasts have been revised lower to $4360 and $67, respectively for end-2026” They stress that the adjustment “reflects a more challenging near-term macro backdrop, rather than a full reassessment of the medium-term structural case for precious metals.”
OCBC highlights that “in particular, the near-term setup has deteriorated for both metals,” pointing to a confluence of headwinds: “real yields have repriced higher, the USD has strengthened, Fed expectations have shifted in a more hawkish direction while ETF demand has slowed.” In their view, a sustained recovery in bullion will hinge on a friendlier macro backdrop, with a “turnaround in gold and silver prices” likely to “require the macro environment to improve and that includes easing in real yields, a softer USD or a clearer unwind in hawkish Fed expectations.”
Absent such a shift, OCBC cautions that “rallies are likely to be faded and gold, silver may spend more time consolidating below previous highs,” underscoring that the bank sees limited scope for a durable breakout until those macro pressures abate.
Gold FAQs
Gold has played a key role in human’s history as it has been widely used as a store of value and medium of exchange. Currently, apart from its shine and usage for jewelry, the precious metal is widely seen as a safe-haven asset, meaning that it is considered a good investment during turbulent times. Gold is also widely seen as a hedge against inflation and against depreciating currencies as it doesn’t rely on any specific issuer or government.
Central banks are the biggest Gold holders. In their aim to support their currencies in turbulent times, central banks tend to diversify their reserves and buy Gold to improve the perceived strength of the economy and the currency. High Gold reserves can be a source of trust for a country’s solvency. Central banks added 1,136 tonnes of Gold worth around $70 billion to their reserves in 2022, according to data from the World Gold Council. This is the highest yearly purchase since records began. Central banks from emerging economies such as China, India and Turkey are quickly increasing their Gold reserves.
Gold has an inverse correlation with the US Dollar and US Treasuries, which are both major reserve and safe-haven assets. When the Dollar depreciates, Gold tends to rise, enabling investors and central banks to diversify their assets in turbulent times. Gold is also inversely correlated with risk assets. A rally in the stock market tends to weaken Gold price, while sell-offs in riskier markets tend to favor the precious metal.
The price can move due to a wide range of factors. Geopolitical instability or fears of a deep recession can quickly make Gold price escalate due to its safe-haven status. As a yield-less asset, Gold tends to rise with lower interest rates, while higher cost of money usually weighs down on the yellow metal. Still, most moves depend on how the US Dollar (USD) behaves as the asset is priced in dollars (XAU/USD). A strong Dollar tends to keep the price of Gold controlled, whereas a weaker Dollar is likely to push Gold prices up.
Author

Eren Sengezer
FXStreet
As an economist at heart, Eren Sengezer specializes in the assessment of the short-term and long-term impacts of macroeconomic data, central bank policies and political developments on financial assets.