Gold Price Analysis: XAU/USD is bullish by inflation expectations

Last week, gold created a new bottom at $1680/oz, the lowest level in the last 10 months. Gold was sold strongly due to the positive news about the economic recovery as well as the expectation of highly vaccinated projects around the world. However, the downtrend did not last long, the economic stimulus package worth 1900 billion USD was approved at the end of last week, causing inflation expectations among investors. The market immediately makes drastic cash flow changes: Wall Street rose, led by technology corporations and heavy industries; gold increased sharply from the bottom of $1680/oz to $1730/oz.
The DXY - US Dollar Index is moving around 91.6 to 91.9. This shows the carefulness of investors in the impact of the recent bailout package and the expectation of a positive economic recovery shot by the FOMC meeting today.
Trend Analysis
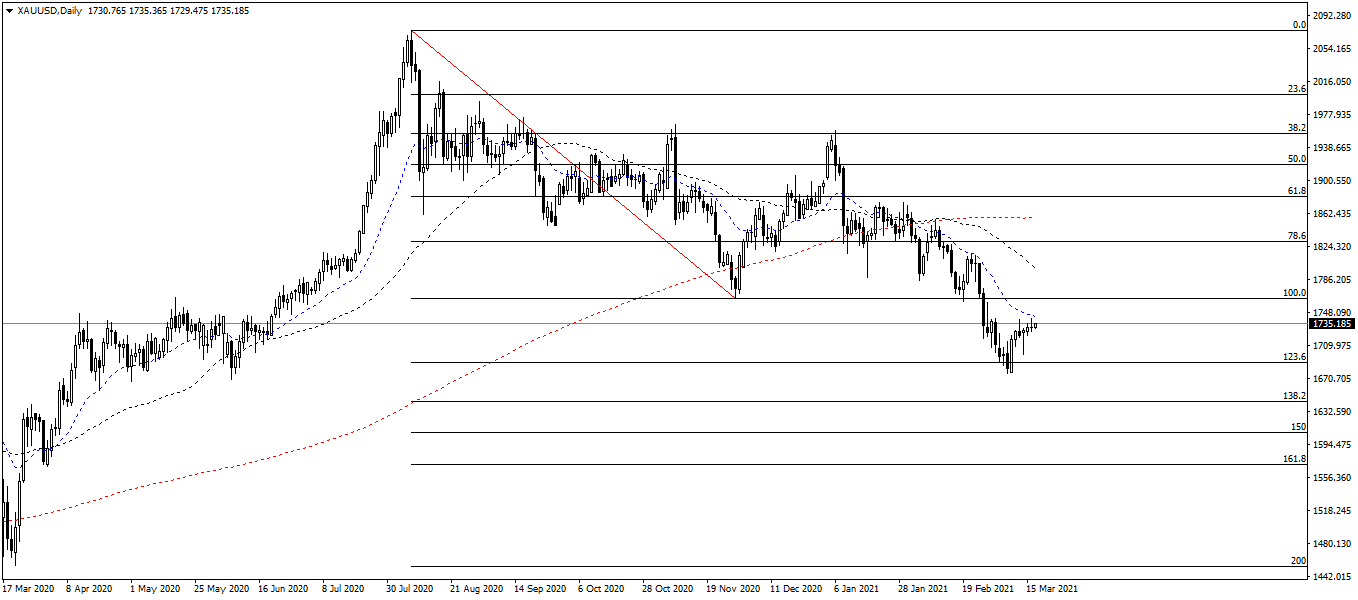
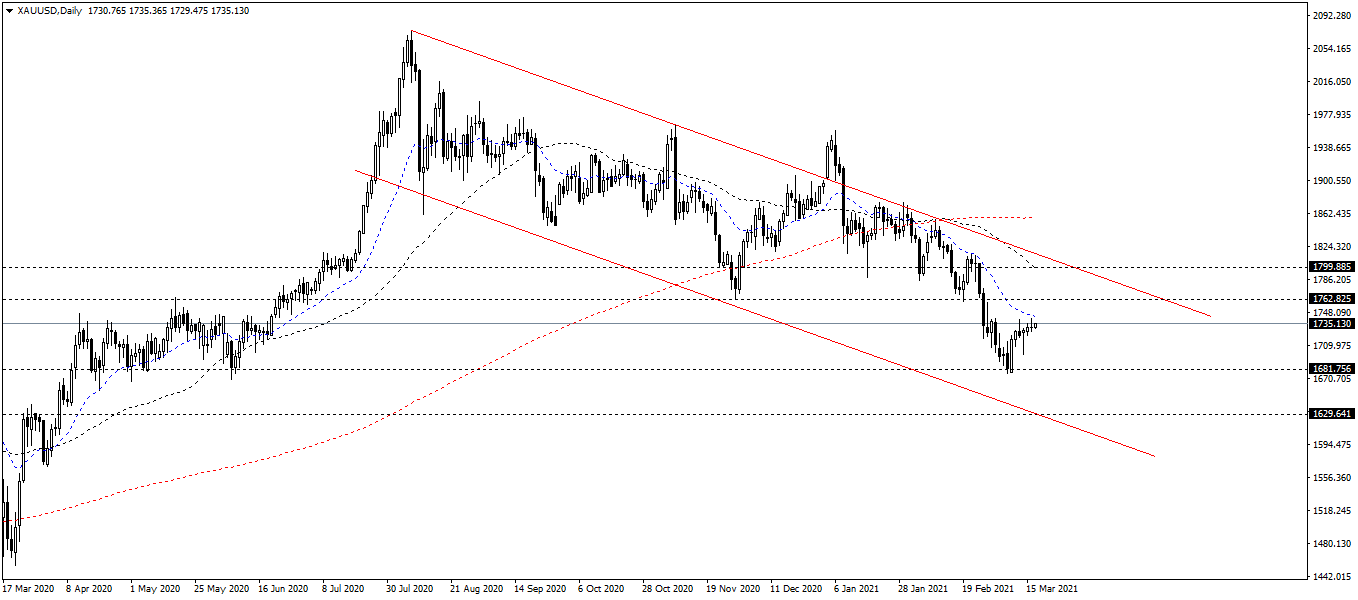
On the Daily chart, gold is still in a downtrend (formed from August 2020). It is in correction after a week of sharp decline. The target of this corrective uptrend is at $1780/oz - $1800/oz.
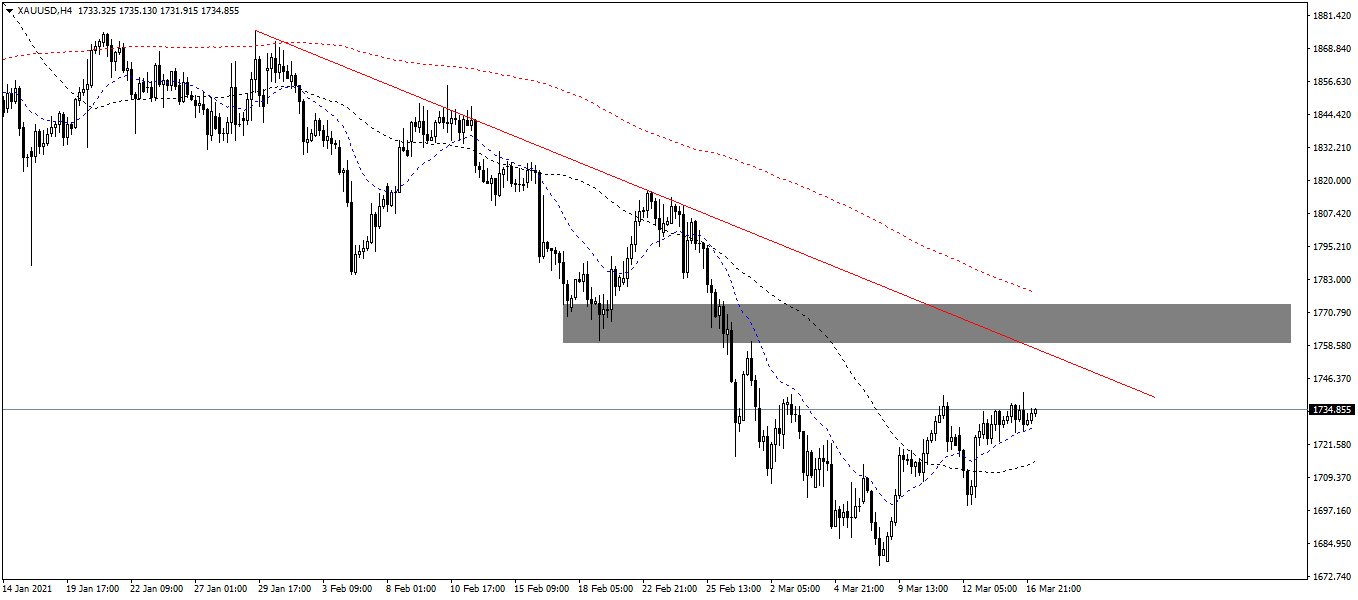
On the 4-hour chart, the adjustment uptrend is easy to see, the maximum wavelength of gold is about $1755/oz - $1765/oz. This is also on the same level with the SMA200 and the downtrend line (formed from February 2020) (see chart below).
Resistance/Support Analysis
The resistances are at $1740/oz and $1760/oz.
The supports are $1670/oz and $1700/oz.
Fibonacci Analysis
The Fibonacci tool is measured on the daily chart at 1760/2070 level. After a strong reaction at the Fibonacci 123.6, gold increased strongly. Moreover, it is coming to the Fibonacci 100, at $1760/oz. This week, if gold can go up to $1760/oz and break this resistance, it is likely that gold will close at $1780/ounce at weekend.
Moving Average MA
On the Daily chart, the SMA50 continues to plummet and make a distance from the SMA200, which shows that in the long-term, gold will continue to fall, at least April this year. The EMA20 continues to decline sharply and creates a long distance from the 2 SMA50/SMA200, this means bearish signals in the mid-term. However, you should note that the EMA20 is starting to show signs of a reversal.
On the 4-hour chart, the EMA20 crosses the SMA50 and turns up, which forms an uptrend. The bullish moving of the EMA20 is to cross the SMA200 at $1760/oz (as I mentioned above). However, in general, both the EMA20/SMA50 are showing strong bearish signals like the analysis on the daily chart.
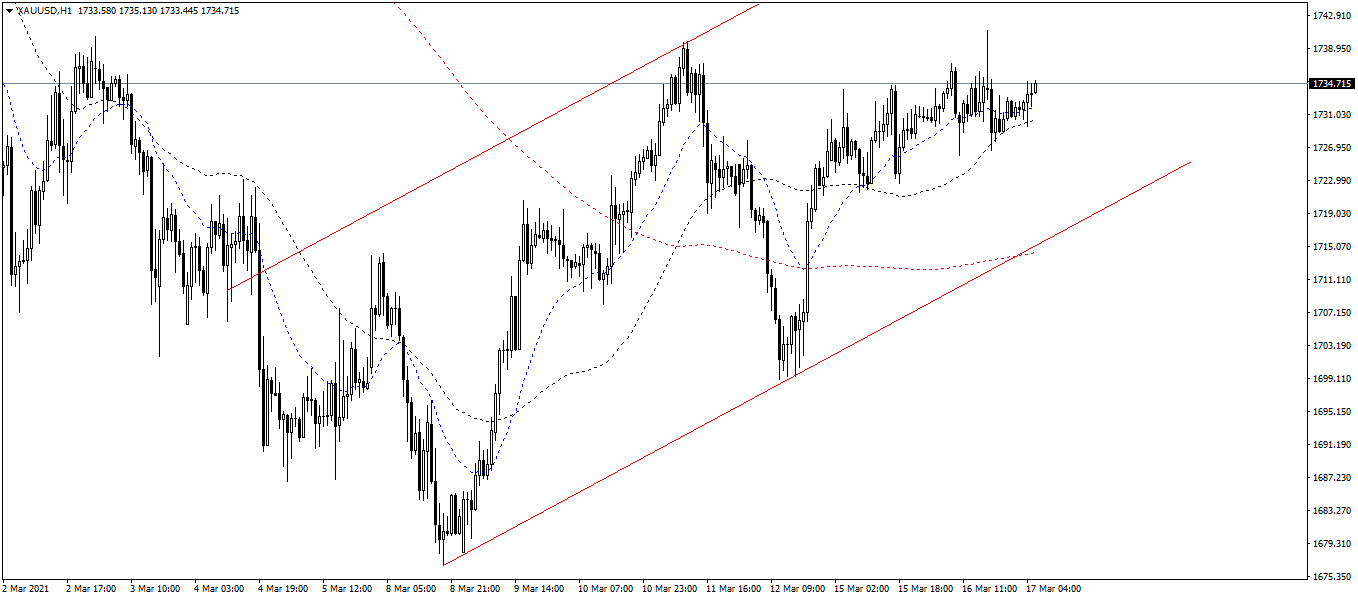
On the 1-hour chart, both the EMA20/SMA50 crossed the SMA200 and went up strongly. The bullish moving is very strong and all 3 moving averages indicators show that.
In summary, Gold will continue to maintain the downtrend in the long-term until at least the end of April this year. Regarding this week, gold continues to increase and adjust to the SMA200.
Author

Thang Le
Independent Analyst
Thang Le is founder and owner of PSK - a financial community in Vietnam which at: Advising on strategic investment for individuals; Supporting the development of the investment community. He is Financial Analyst at Lion Group Hol


