Gold price analysis: The bulls play a significant role this week

Gold is as calm as a toad in the sun in the first session of the week, moving slightly around $1894/oz and $1900$/oz. The DXY - US Dollar Index stands at the zone of 89.1 and 90.1, so there is no chance for a significant move today.
This week, the US Government continues to auction 10Y treasury bonds. Moreover, because the FED has changed their approach, like Ms. Janet Yellen said, the FED is highly likely to think about raising interest rates, or at least changes the approach in buying bonds and other assets. This will make a significant impact on the 10Y bond yields (which has changed 10.36% for 5 months) and gold.
Lastly, this Thursday, the CPI m/m (Consumer product index monthly) will be released. If it is lower than forecast, there will be good news for the DXY. In contrast, there will be significant cash that flows into other assets like gold.
Trendline analysis
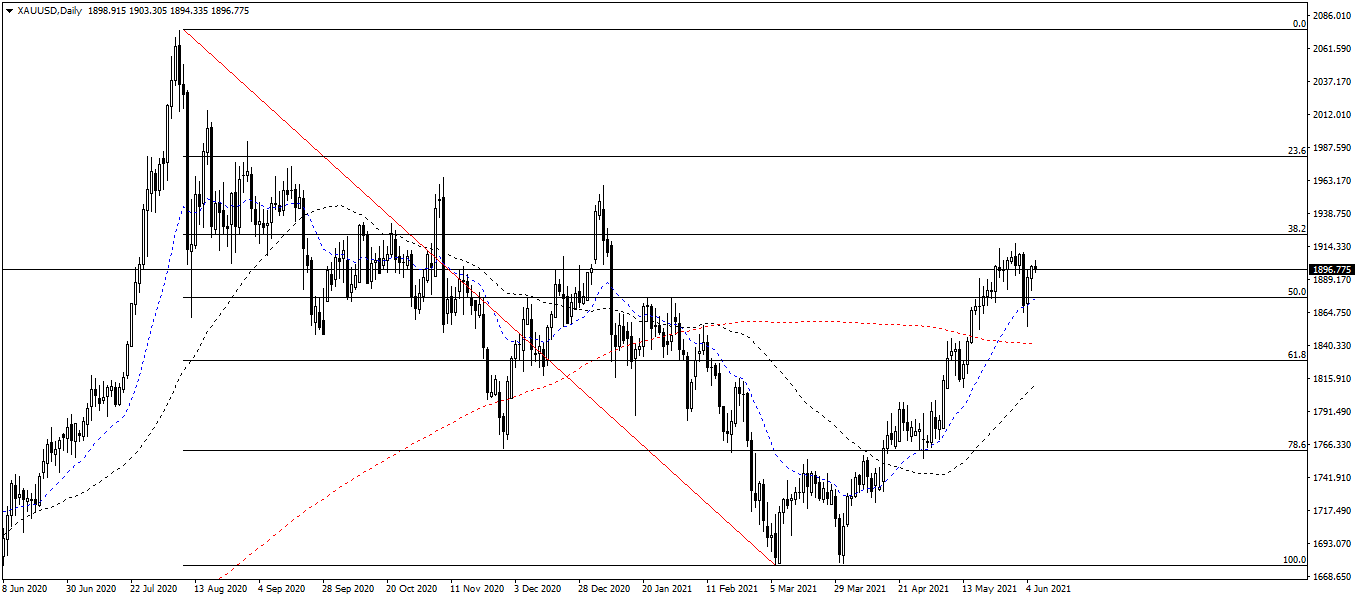
On the daily chart, gold has broken the uptrend (which made from August 2020) and made a sideway zone. If gold continues to make a significant break-out above $1915/oz, gold might come back to the old high last year (see chart below).
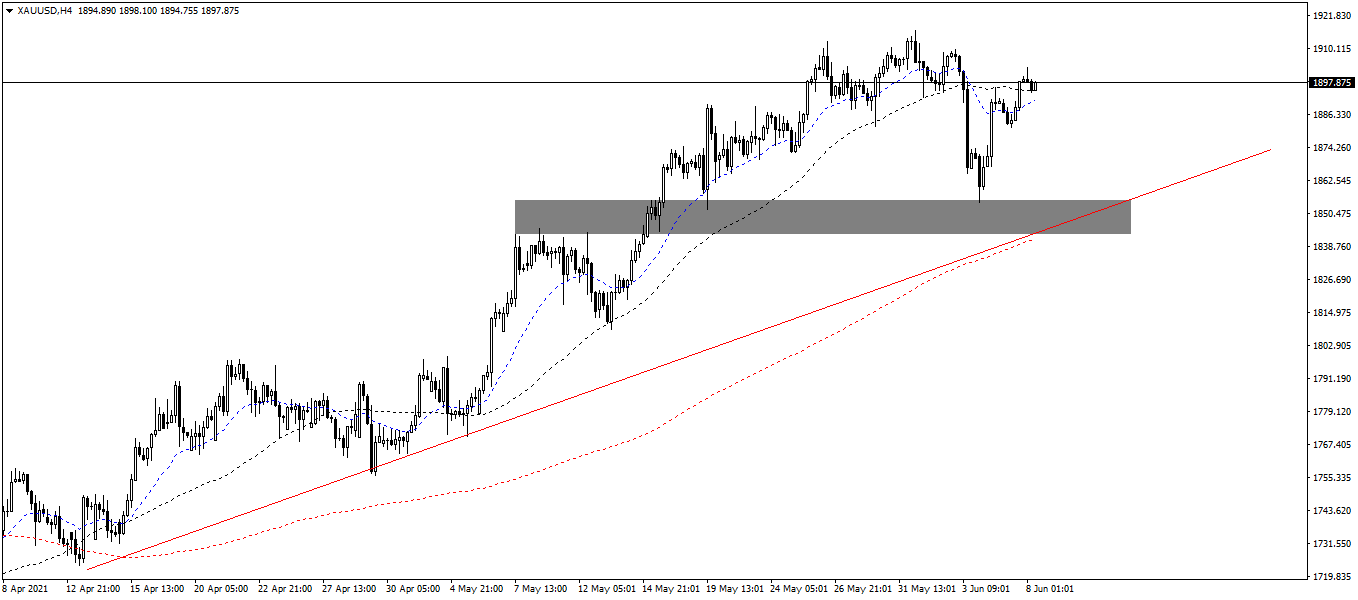
On the 4-hour chart, gold is on an uptrend (made from March 2021). This shows that in the long-term and mid-term, the bulls still work very hard. However, gold is on the highest swing day in a week, there might be some bearish correlations this week (see chart below).
Resistance/support analysis
The resistances are $1915/oz, $1930/oz and $1960/oz.
The supports are $1875/oz and $1855/oz.
Fibonacci analysis
The Fibonacci has measured on the daily chart at:
-
The $2080/oz: this is the highest price of gold over the time.
-
The $1760/oz: this is the oldest support on the bearish trend. (formed from August 2020).
Last week, gold fell back to test the Fibonacci 50 and climbed up to the Fibonacci 38.2. This shows that the bulls keep controlling and gold is likely going up to the Fibonacci 38.2 again, making a new high this year.
Moving average analysis
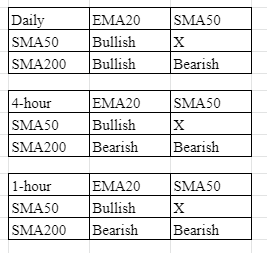
On the daily chart, the EMA20 crossed the SMA200 and went up, showing a bullish trend. The SMA50 climbs up, heads for the SMA200, creates a clear bullish trend in the mid-term and long-term.
On the 4-hour chart, both the EMA20/SMA50 continuously crossed, drawing a sideway zone. However, both these MAs are above the SMA200, showing a bullish trend.
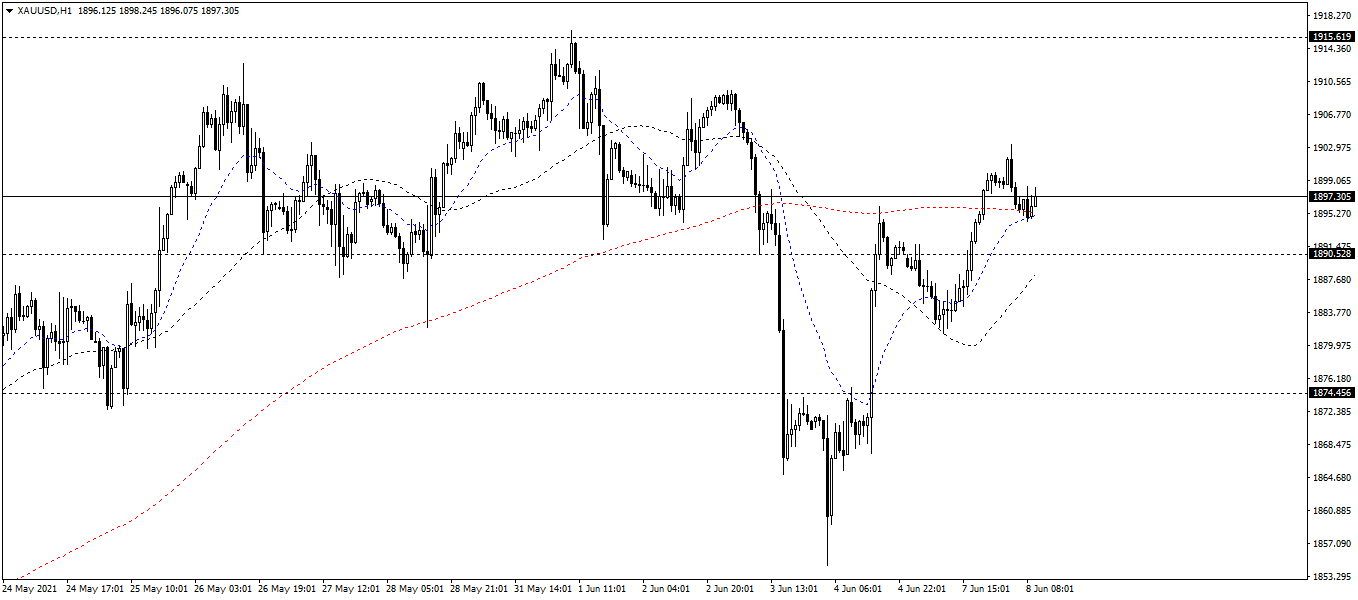
On the 1-hour chart, the two EMA20/SMA50 are below the SMA200, but they show a clear significant signal for the moving of the bulls.
In conclusion, the bulls is the main line of gold in the long-term and mid-term. There is a small chance for the bears in the short-term.
Author

Thang Le
Independent Analyst
Thang Le is founder and owner of PSK - a financial community in Vietnam which at: Advising on strategic investment for individuals; Supporting the development of the investment community. He is Financial Analyst at Lion Group Hol


