Gold price analysis: Gold, vaccine and the economic index this week

Gold is in a correlation phase after a significant climbing, from $1765/oz to $1798/oz. At present, gold is slightly moving around $1784/oz and $1790/oz.
Because of the positive news from the FED on the economy, the DXY slightly went up. Moreover, these bond yields (US10Y and US1Y) began to improve significantly, which showed optimism of Wall Street, at least during the London session and next New York session.
Covid-19 pandemic also makes a significant impact on pushing gold to a higher level: the ineffective anti-Covid-19 approach of Asia country (like India, Korea, Phillipine and Thailand); the percentage of vaccinated people did not reach the expectation; the number of infection/death rose uncontrollably.
This week, the Unemployment rate and the Non-farm employment are important information that affect the US Dollar and especially gold. Moreover, the BOE - Bank of England is going to announce a monetary policy report, asset purchase facility in the open market which will have a significant impact on commodities, especially gold.
Trendline analysis
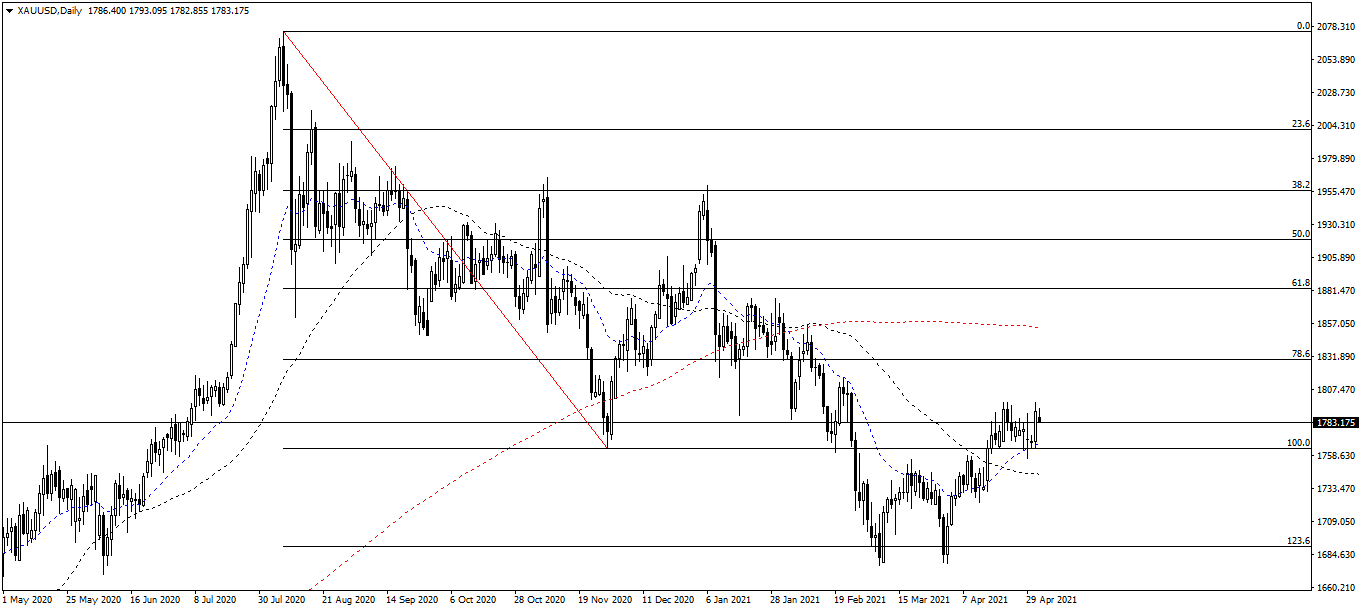
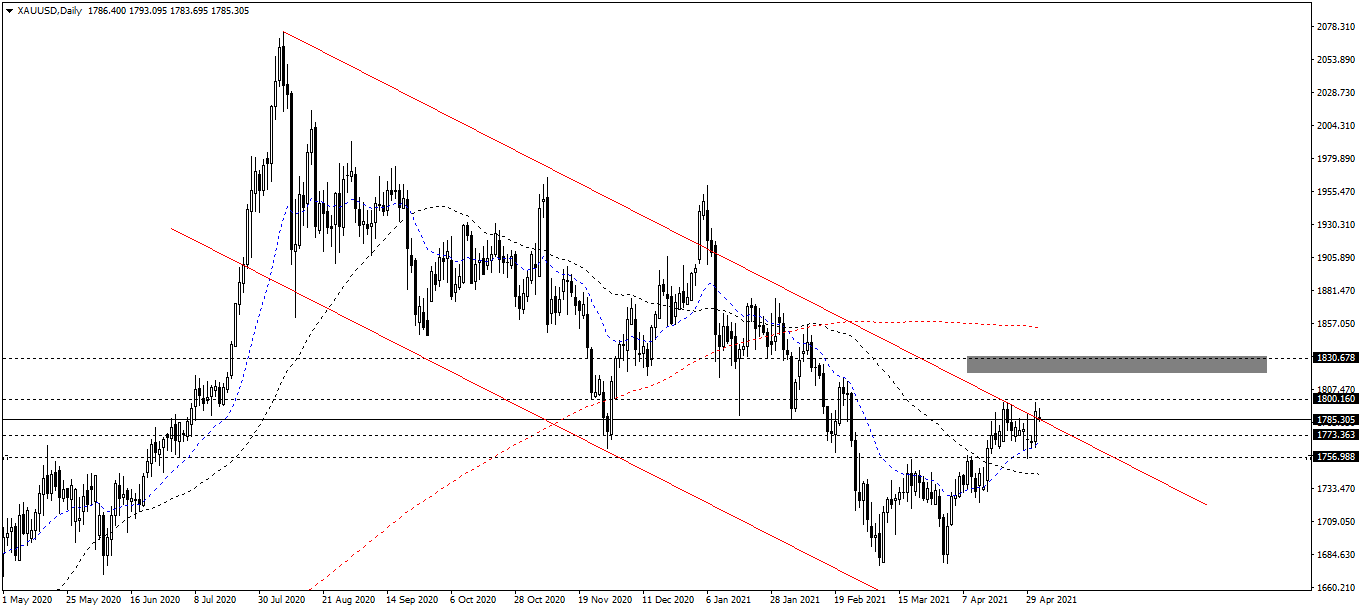
On the daily chart, gold is still on a bearish trend (formed in August 2020). It likely reaches the highest level of this upwave. But, the maximum wavelength is about $1830/oz, showing the bulls highly likely makes an impact in this week. (see chart below)
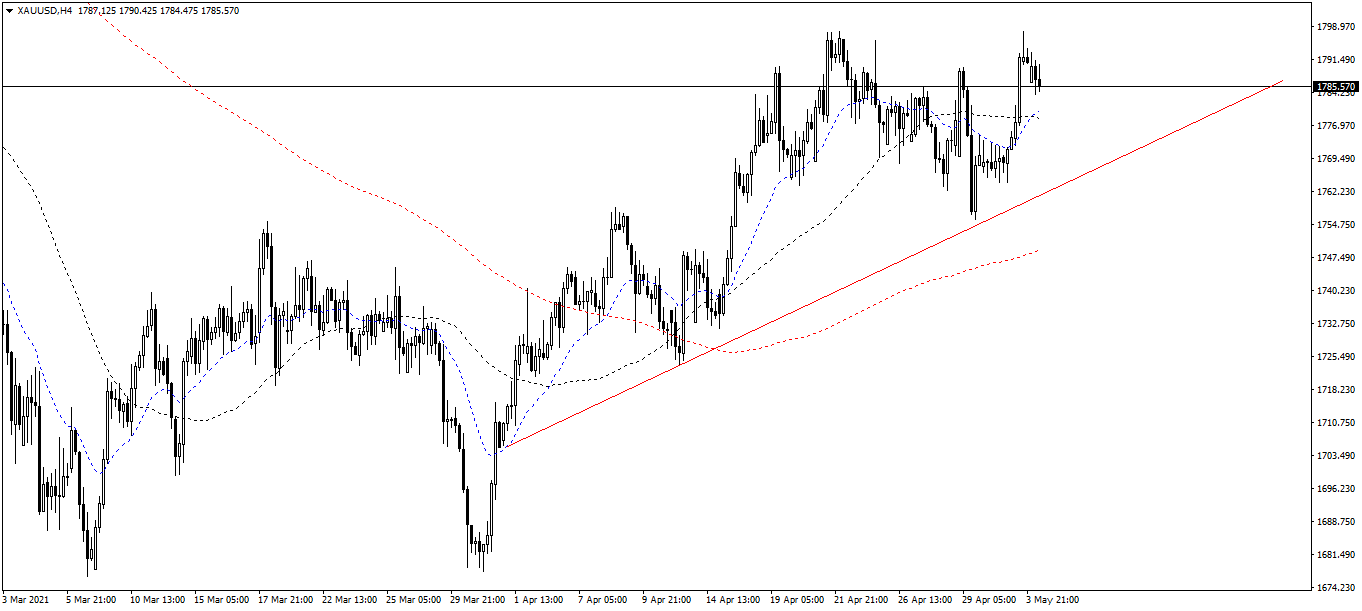
On the 4-hour chart, gold is on a bullish trend (formed in March 2021). This uptrend is supported by the weakness of the US Dollar last week and the instability of covid-19 prevention, especially in India.
Resistance/Support analysis
The resistances are $1800/oz and $1830/oz.
The supports are $1772/oz and $1756/oz.
Fibonacci analysis
The Fibonacci has measured on the daily chart at:
- The $2080/oz: this is the highest price of gold over the time.
- The $1760/oz: this is the oldest support on the bearish trend. (formed from August 2020).
After breaking-out the Fibonacci 100, gold climbed up to $1780/oz and made an accumulation. The next target of this uptrend is Fibonacci 78.6, which means $1830/oz. Especially at $1830/oz, there is a significant resistance.
Moving average MA analysis
On the daily chart, the EMA20 crossed the SMA50 and went up, showing the bullish trend. Both the EMA20/SMA50 is below the SMA200, which means in the mid-term and long-term, gold is dominated by the bears.
On the 4-hour chart, the EMA20 continuously crossed each other, which makes an accumulation. Both the EMA20/SMA50 is above the SMA200, showing that in the short-term, gold is dominated by the bulls, at least this week.
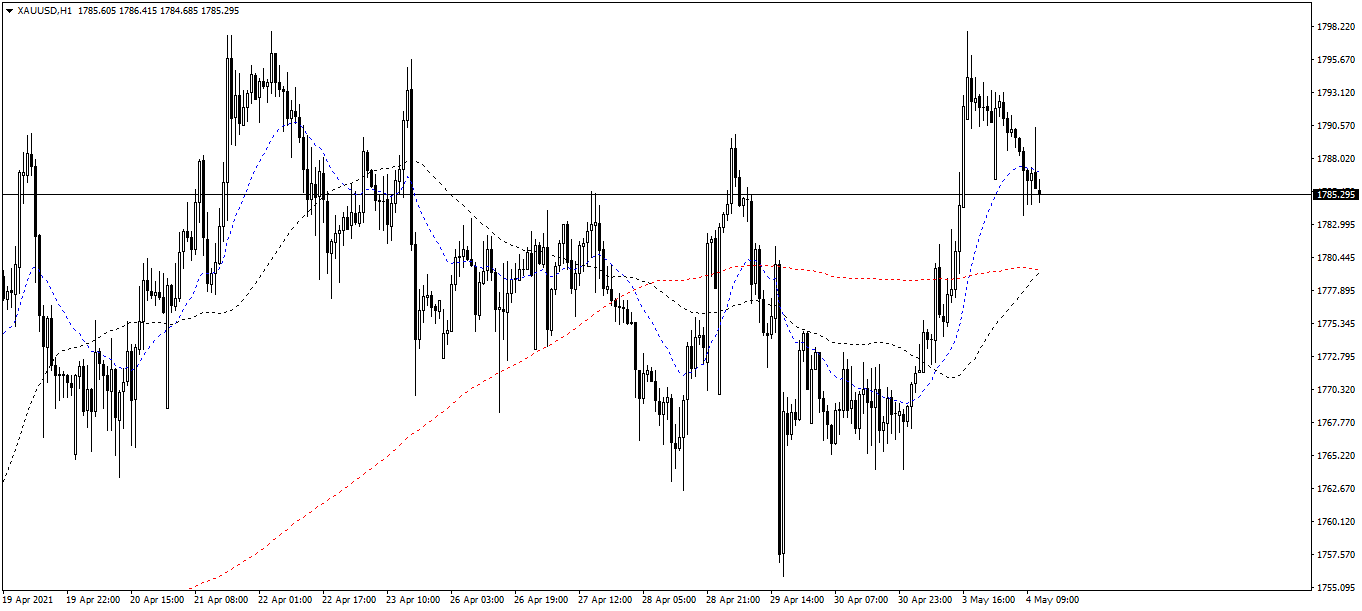
On the 1-hour chart, the EMA20 crossed the SMA50 and went up, showing the bullish trend. The EMA20 crossed the SMA200 and went up, showing the bullish trend. The SMA50 crossed the SMA200 and went up, showing the bullish trend. Therefore, this chart shows a positive signal for the bulls.
In conclusion, in the mid-term and long-term, gold is bullish, at least in May and Q2/2021. In the short-term, gold is bearish, at least this week.
Author

Thang Le
Independent Analyst
Thang Le is founder and owner of PSK - a financial community in Vietnam which at: Advising on strategic investment for individuals; Supporting the development of the investment community. He is Financial Analyst at Lion Group Hol


