Gold Price analysis: Gold heads to $1680/oz, accumulating waiting for new signals from the Fed

This week, gold has moved around $1725/oz - $1760/oz because of the news from FED and the USD moving up. The DXY - US Dollar Index significantly climbed up from 93.8 to 94.2 for a few hours which made gold fall down strongly.
This Friday, the US Government will release the GDP q/q. The forecast is 6.6% and there is a chance for a lower number because the Covid-19 pandemic has not decreased in Asia and Europe. Moreover, the next testimony of US Federal Reserve Chairman - Jerome Powell, will have a significant impact on the economy.
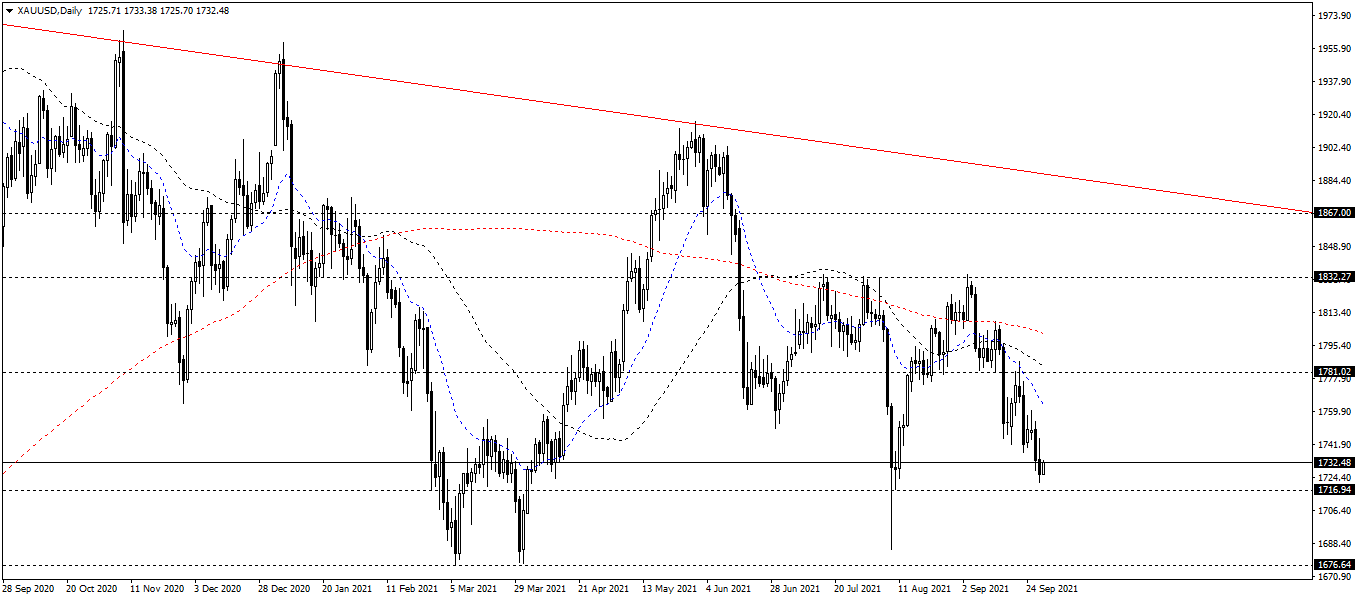
Trendline analysis
On the daily chart, the bears actively made gold fall down, from $1832/oz (which formed from the beginning of September) to $1725/oz. The uptrends were broken whenever they likely showed up. In October, gold is going to have more negative news because the Asian countries are recovering quickly (see chart below).
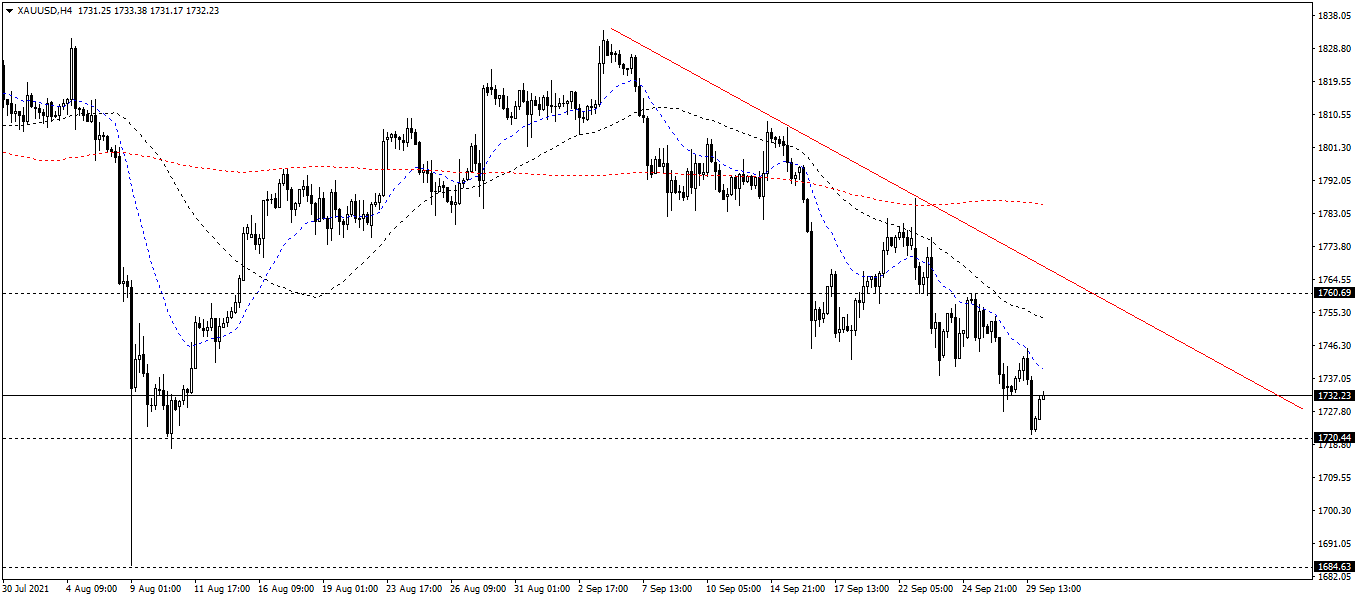
On the 4-hour chart, the bears broke 2 supports - $1760/oz and $1730/oz, and came closer to the $1720/oz. The bulls is significantly weak and there is no signal for them in this chart (see chart below).
Resistances/Supports analysis
The resistances are $1860/oz, $1830/oz and $1780/oz.
The supports are $1715/oz and $1680/oz.
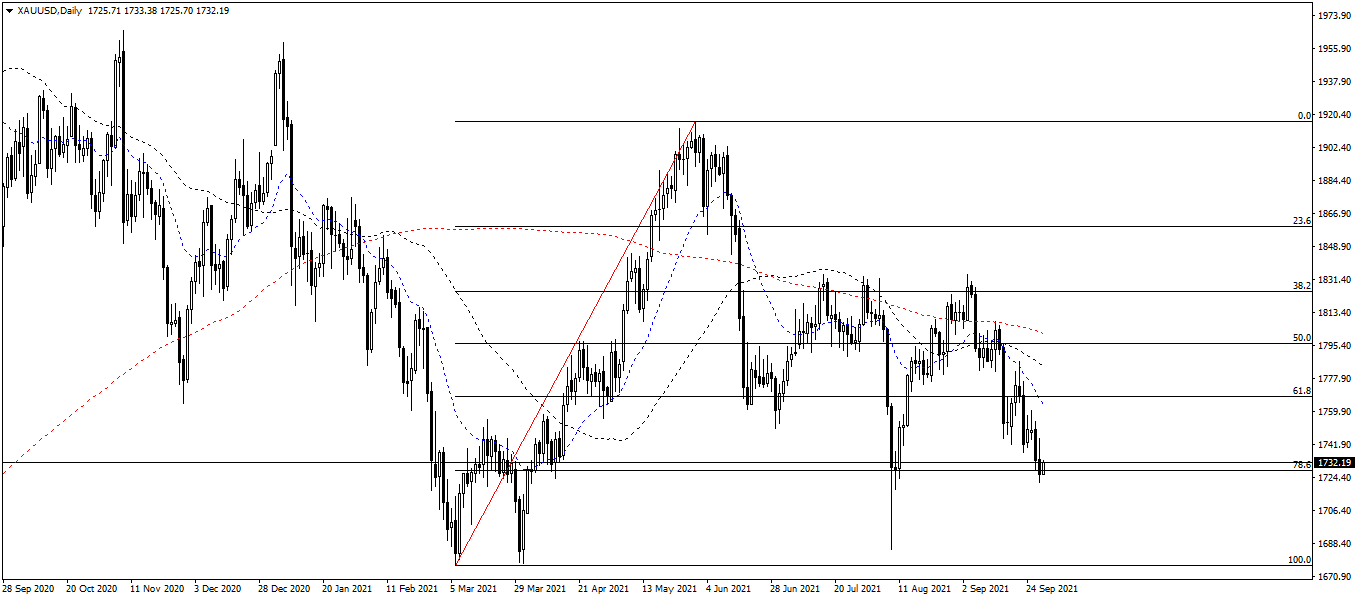
Fibonacci analysis
The Fibonacci indicator is measured on the daily chart at 2 levels:
-
The $1920/oz: This is a double top pattern, which is made in the last 6 months.
-
The $1680/oz: The strongest support in the past 2 years.
Gold is moving around the Fibonacci 78.6. This level is considered as a strong dynamic support which makes the bears hesitate. If gold breaks this level, it will clearly head to $1680/oz.
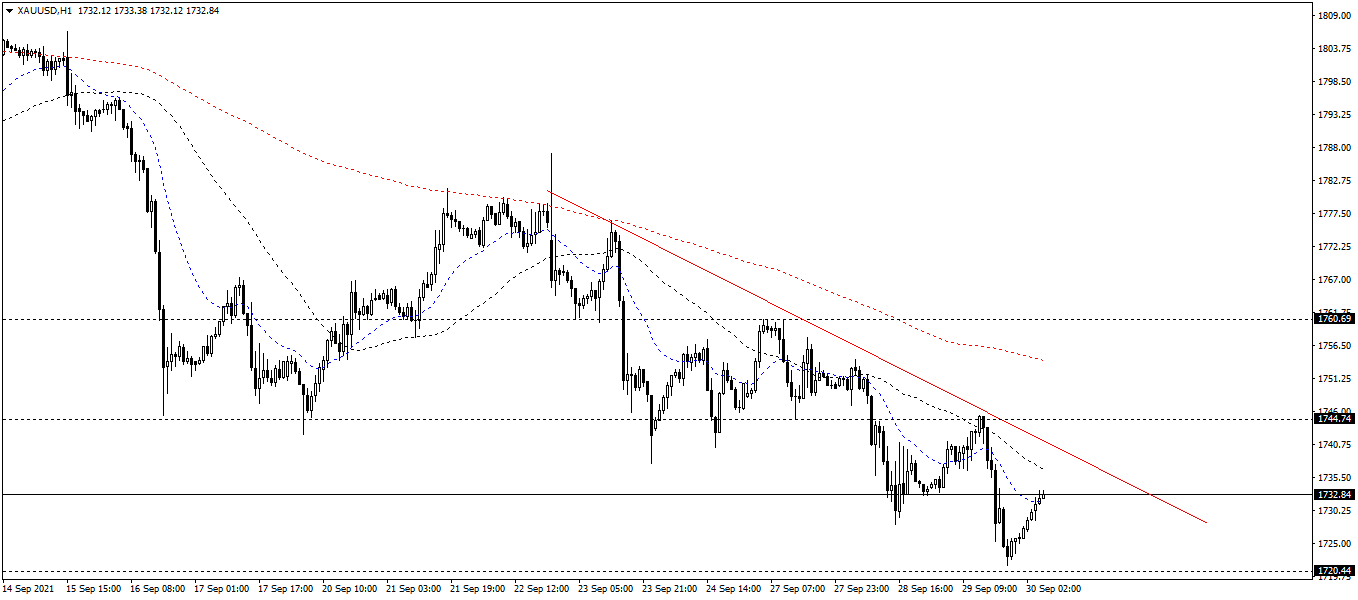
MA analysis
On the daily chart, the MA20 is below the MA50/MA200, showing a significant bearish trend on this chart.
On the 4-hour chart, we can see the diversification which is drawn by the 3 MA indicator line because the MA20/MA50 is below the MA200. The bears is dominating this chart.
On the 1-hour chart, the MA20 is below MA50/MA200 and makes a strong ebb. The MA50 is below and makes a significant space from the MA200.
In conclusion, the bearish trend is dominating all of the charts. The bears has a favor from the fundamental analysis and the technical analysis at this time.
Author

Thang Le
Independent Analyst
Thang Le is founder and owner of PSK - a financial community in Vietnam which at: Advising on strategic investment for individuals; Supporting the development of the investment community. He is Financial Analyst at Lion Group Hol


