|

Gold Price Analysis 26th May Update

Gold price is trading near to its watching zone as we discussed in the previous analysis. Gold is still trading in a range and forming a symmetric triangle on an hourly chart.

The beauty of symmetric triangle is, it always give handsome move after breaking the triangle range. We need to check it out either it will break support or the resistance to predict the movement.

The triangle is becoming narrow and it is now predictable if we look close to its resistance or support levels.

The narrow resistance is forming around 1259-61 zone and the support according to current price is around 1254-55.

If gold break the resistance and close above 1263 level, this will confirm the resistance break and could take gold towards its next target around 1277.

If gold break the support and close below 1251, this will be the indication of support break out and may take gold towards the 1233-37 minimum.

Please keep in mind, we will consider the break after the closing of the hourly candle, which means if candle closes below the suggested price on an hourly chart, This will be the signal to jump in.

Please have a look at the hourly chart below, I have mentioned possible watching zone and target levels.

Gold Hourly Chart

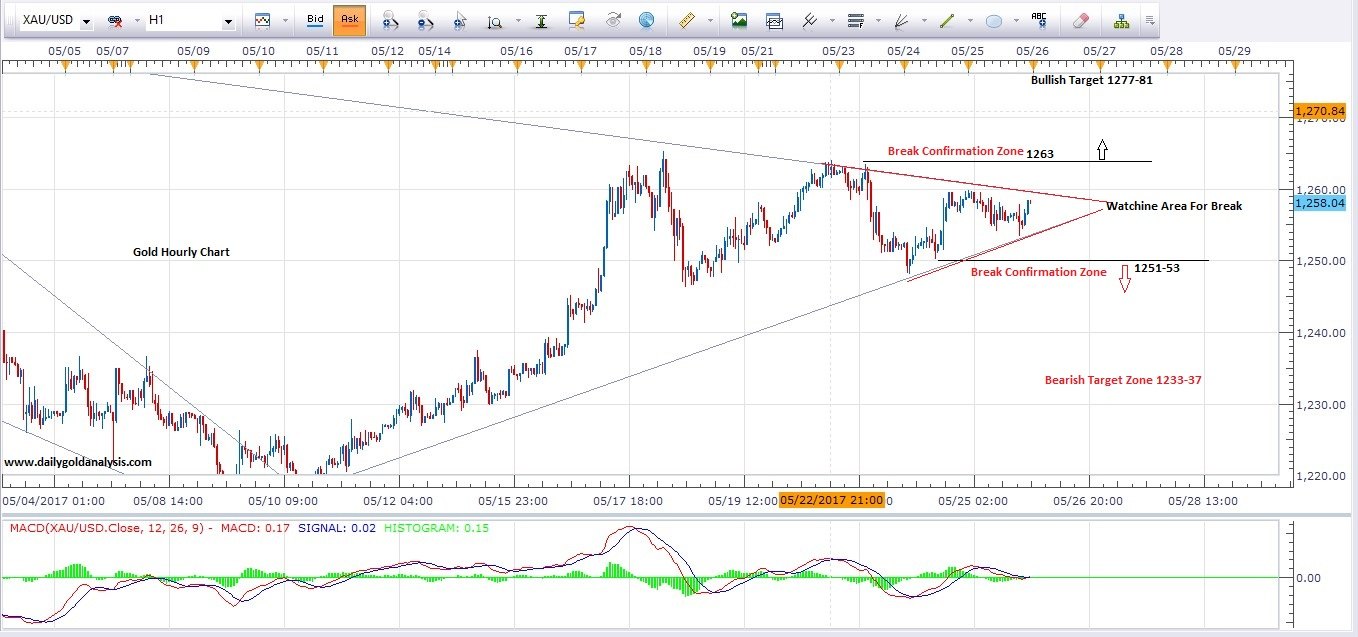
Hourly Gold Chart Update

Watching Levels For Gold Trade

Resistance: 1259-61  ==> Break Confirmation For Bullish Move 1263.50

Support: 1253-54 ==> Break Confirmation For Bearish Move 1249

    1. R3 1265.37
    2. R2 1262.51
    3. R1 1258.71
  1. PP 1255.85
    1. S1 1252.05
    2. S2 1249.19
    3. S3 1245.39

Gold Price Predictions


Author

Mati Ur Rehman

Mati Ur Rehman

DailyGoldAnalysis

Mati Ur Rehman is a seasoned forex trader with over 15 years of experience in the financial markets, specializing in technical analysis of gold and major currency pairs.

More from Mati Ur Rehman
Share:

Editor's Picks

EUR/USD hits two-day highs near 1.1820

EUR/USD picks up pace and reaches two-day tops around 1.1820 at the end of the week. The pair’s move higher comes on the back of renewed weakness in the US Dollar amid growing talk that the Fed could deliver an interest rate cut as early as March. On the docket, the flash US Consumer Sentiment improves to 57.3 in February.

GBP/USD reclaims 1.3600 and above

GBP/USD reverses two straight days of losses, surpassing the key 1.3600 yardstick on Friday. Cable’s rebound comes as the Greenback slips away from two-week highs in response to some profit-taking mood and speculation of Fed rate cuts. In addition, hawkish comments from the BoE’s Pill are also collaborating with the quid’s improvement.

Gold climbs further, focus is back to 45,000

Gold regains upside traction and surpasses the $4,900 mark per troy ounce at the end of the week, shifting its attention to the critical $5,000 region. The move reflects a shift in risk sentiment, driving flows back towards traditional safe haven assets and supporting the yellow metal.

Crypto Today: Bitcoin, Ethereum, XRP rebound amid risk-off, $2.6 billion liquidation wave

Bitcoin edges up above $65,000 at the time of writing on Friday, as dust from the recent macro-triggered sell-off settles. The leading altcoin, Ethereum, hovers above $1,900, but resistance at $2,000 caps the upside. Meanwhile, Ripple has recorded the largest intraday jump among the three assets, up over 10% to $1.35.

Three scenarios for Japanese Yen ahead of snap election

The latest polls point to a dominant win for the ruling bloc at the upcoming Japanese snap election. The larger Sanae Takaichi’s mandate, the more investors fear faster implementation of tax cuts and spending plans. 

XRP rally extends as modest ETF inflows support recovery

Ripple is accelerating its recovery, trading above $1.36 at the time of writing on Friday, as investors adjust their positions following a turbulent week in the broader crypto market. The remittance token is up over 21% from its intraday low of $1.12.