Gold outlook: US July CPI rates next big test for Gold’s price

Gold’s price maintained its sideways remaining near the same levels as last week’s report. Today’s report is to discuss fundamental issues affecting gold’s price and we are to conclude it with a technical analysis of gold’s daily chart.
Blurred negative correlation of USD with Gold
We make a start by noting that gold’s negative correlation with the USD seems to be active, yet remains relatively blurred. The jump of gold’s price on Friday’s American opening coincided with the simultaneous tumbling of the USD against its counterparts, as indicated by the USD Index. Hence one could assume that the negative correlation of the two trading instruments is in effect. Yet the rise of gold’s price was disproportionate to the drop of the USD, while furthermore the movement was followed by a relative stabilisation of both trading instruments on Monday. Thus we view the negative correlation of the two trading instruments as active yet blurred. Hence should we see the USD weakening further against its counterparts and be accompanied also by a drop of US yields, we may see gold’s price getting additional support. Interestingly enough, US bond yields also dropped on Friday which may have contributed to the rise of gold’s price as it may have diverted safe haven investments towards the precious metal.
The shock of July’s US employment data and the Fed
The catalyst behind the weakening of the USD and the simultaneous rise of gold’s price may have been the release of the US employment data for July. The weak US employment data for July, with the main market focus being on the wider-than-expected drop of the NFP figure, implied a rapidly cooling US employment market. Note that also the NFP figures of June and May were revised lower, by a massive aggregated 258k. Also, the unemployment rate ticked up as expected, reaching 4.2%. The release revived market expectations for the Fed to proceed with two rate cuts until the end of the year, possibly even three, with the first being expected in the September meeting and the second in the October meeting. The corrections lower of the NFP figure practically intensified market worries for the outlook of the US employment market but also the validity of the data provided. The issue, enabled US President Trump to fire Bureau of Labor Statistics Commissioner Erika McEntarfer the same day, which adds more worries for a possible manipulation of the figures. Also, the unexpected resignation of Fed Board Governor Kugler tends to create some uncertainty for the independence of the Fed, as US President Trump now has an opening to fill, practically replacing a hawk with a dove. At the same time, market rumors for a possible shadow Chairman to be appointed until Powell’s term ends, late spring next year intensified, which may continue supporting gold’s price. Overall, we expect Fed policymakers scheduled to speak in the coming days to be closely watched by market participants. Should we see Fed policymakers adopting a more dovish tone, which in turn may enhance the market’s expectations for the bank to ease its monetary policy, we may see gold’s price gaining some ground, while the adoption of a possibly hawkish tone could contradict market sentiment and thus weigh on gold’s price.
Financial releases that could affect Gold’s price
As these lines are written, market focus is to be placed on the release of the US ISM non manufacturing PMI figure for July later today. The indicator’s reading is expected to rise from 50.8 to 51.5 in July, which implies a faster expansion of economic activity in the US services sector. Should the indicator’s reading rise beyond market expectations we may see market worries for US macroeconomic outlook easing, thus weighing on gold’s price, bearing in mind that the sister indicator for the manufacturing sector for the same period, had unexpectedly dropped on Friday causing worries for the expansion of economic activity in the US economy. The highlight though is expected to be the release of July’s US CPI rates next Tuesday. Given the release of the US employment report for July, past Friday, we view the US July CPI rates as the next big test for gold’s price. Should we see the rates accelerating both on a headline and core level for the past month, the release could imply a persistence of inflationary pressures within the US economy which in turn may ease once again the market’s dovish expectations for the Fed’s intentions, thus weighing on gold’s price.
Technical analysis
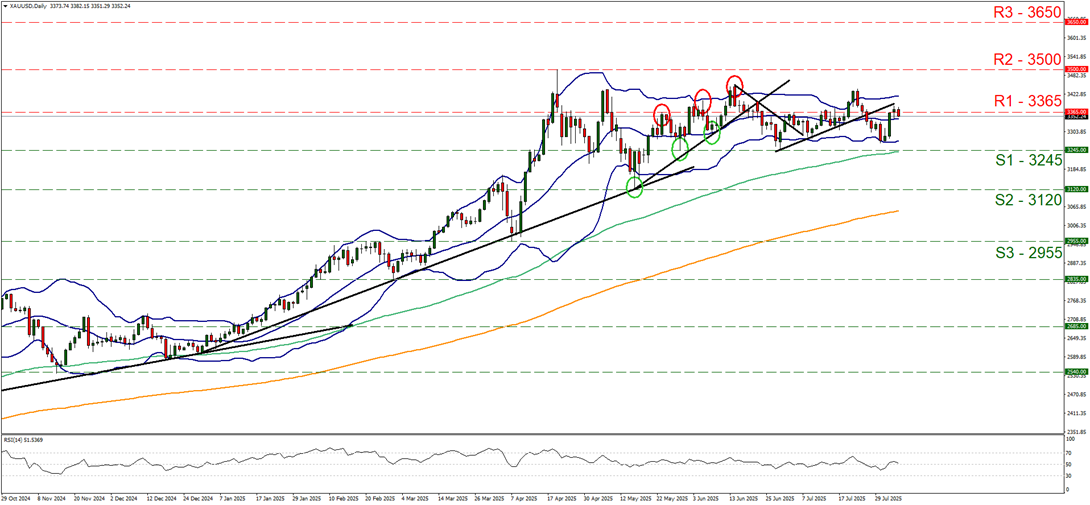
XAU/USD daily chart
-
Support: 3245 (S1), 3120 (S2), 2955 (S3).
-
Resistance: 3365 (R1), 3500 (R2), 3650 (R3).
Gold’s price edged higher on Friday and yesterday tested unsuccessfully the 3365 (R1) resistance line, correcting lower in today’s Asian and European sessions. For the time being we view any bullish tendencies of the precious metal’s price as unconvincing, hence we maintain our bias for a sideways movement as expressed in last week’s report. It’s characteristic that the RSI indicator remains near the reading of 50, implying a rather indecisive market, while the Bollinger bands tend to remain relatively narrow implying lower volatility for gold’s price. The behaviour of the prementioned two indicators, suggests a possible continuation of the rangebound motion. Should the bulls take over, we may see gold’s price clearly breaking the 3365 (R1) resistance line and start actively aiming if not reaching the 3500 (R2) resistance barrier, which marks an All Time High (ATH) level for the precious metal’s price. On the flip side, for a bearish outlook we would require the shiny metal’s price to break the 3245 (S1) support line, which is the lower boundary of the current sideways movement of gold’s price and thus pave the way for the 3120 (S2) support barrier, which successfully reversed gold’s downward motion on the 15th of May.
Author

Peter Iosif, ACA, MBA
IronFX
Mr. Iosif joined IronFX in 2017 as part of the sales force. His high level of competence and expertise enabled him to climb up the company ladder quickly and move to the IronFX Strategy team as a Research Analyst. Mr.


