Gold Miners Underperform Even While Breaking Out

Gold Miners Underperform Even While Breaking Out
Gold miners soared in the last few weeks, broke above their declining medium-term resistance line. The picture is therefore clearly bearish, right? Not so fast – if the outlook was bullish, miners should be leading gold higher, just like they did in 2016, and this is definitely not the case. What gives? What are gold stocks really trying to tell us?
Let’s start with the underperformance. Gold is quite close to its 2016 highs, but gold stocks…
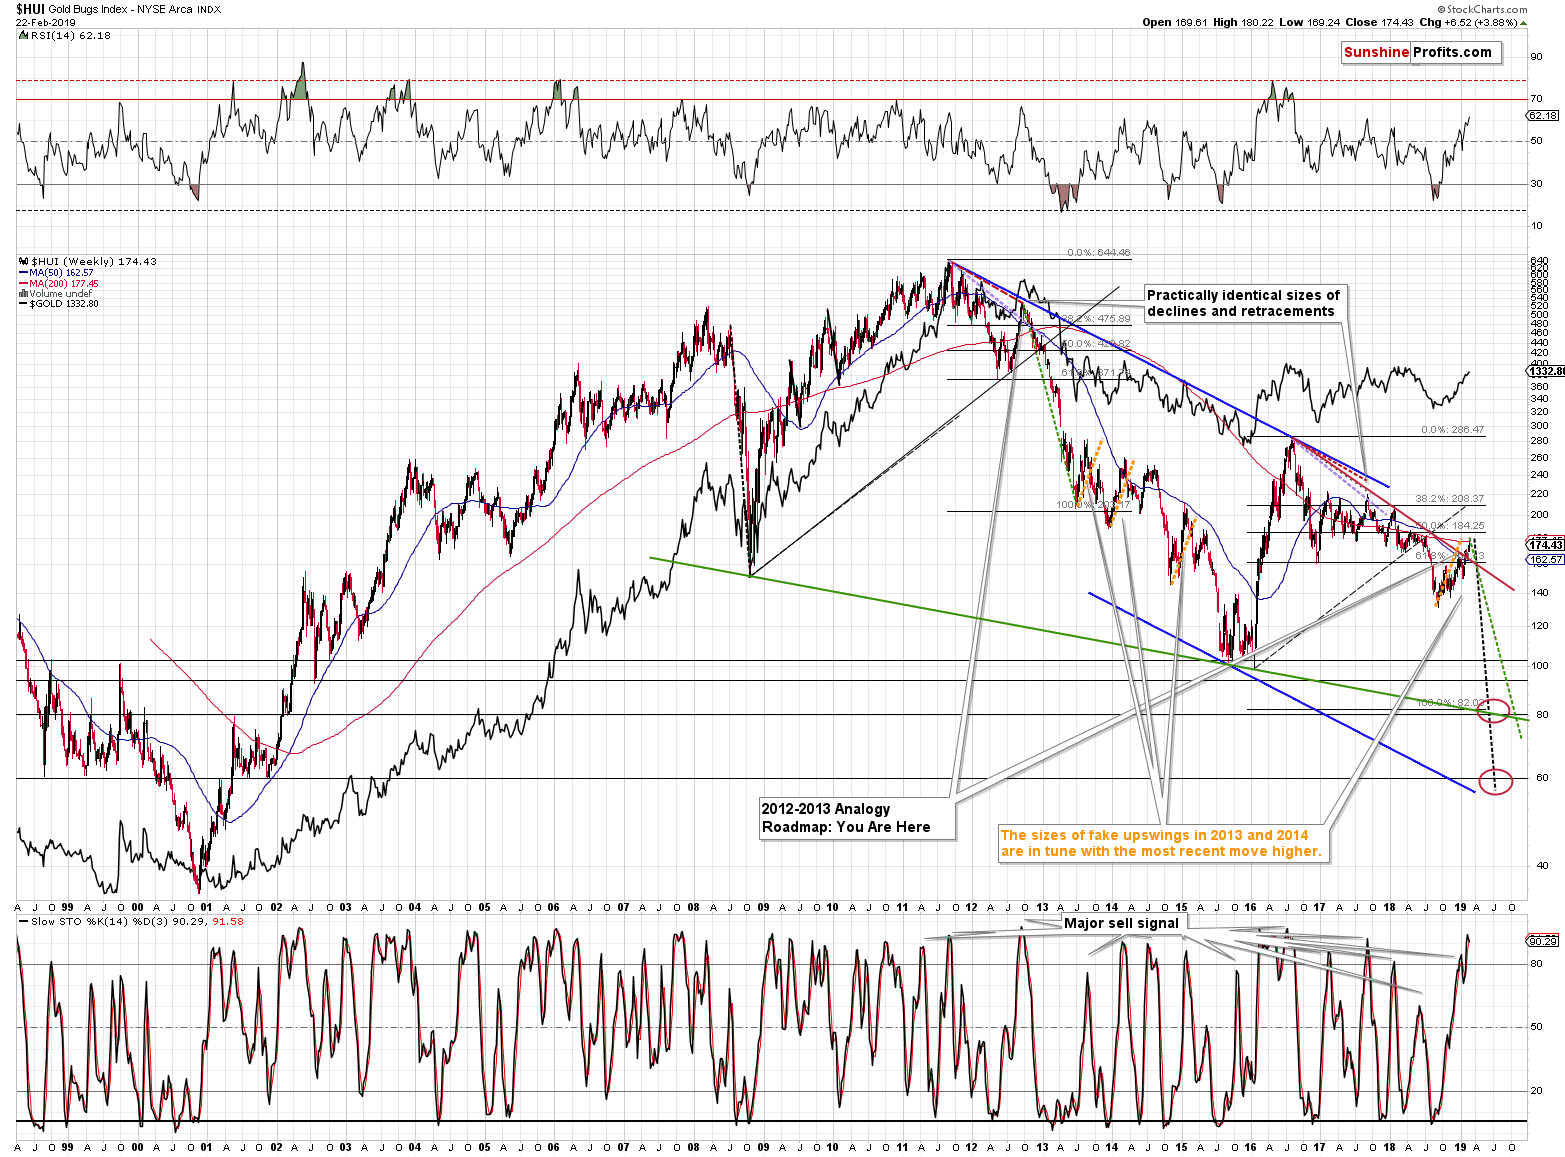
Gold stocks are not even close. The HUI Index - classic proxy for gold miners – would need to increase its value by about 65% to match the 2016 high. And the size of the most recent upswing?
The last several months of higher prices are nothing to call home about when examined from the long-term point of view. In fact, looking at the forest instead of discussing individual trees, shows us something very interesting.
Please take a look at the orange text and lines on the above chart. The most recent upswing (called “start of the new bull market” by many analysts and gold promoters) is actually just as big as the three corrective downswings that we saw during gold miners’ profound 2012 – 2016 decline. How profound can the implications of a rally truly be, if it’s just like the moves that were previously followed by powerful and volatile declines?
The weekly Stochastic indicator provides very useful signals in case of gold mining stocks. And by useful, we mean effective. It was almost always the case that we saw a major top when Stochastics flashed a weekly sell signal – and it did so based on last week’s closing prices.
But gold miners are rallying – just like in 2016!
They may have moved higher – that’s true, but this move was definitely not at all as it was in 2016. At least not with regard to the direction. In 2016 gold mines truly soared and outperformed gold, leading it higher. This is definitely not happening right now. The move is relatively small (compared to what happened in 2016) and gold stocks underperform gold, instead of leading it higher. The more likely analogy to 2016 is likely to be the fakeness of the breakout that we just saw. In early 2016, the HUI Index briefly broke below the previous lows and started the powerful rally right after invalidating this fake move. The opposite appears likely right now – miners are likely to invalidate their recent breakout and then decline with vengeance.
But the breakout did happen after all!
Yes, mining stocks moved above their declining red resistance line, which is generally a bullish phenomenon. However, we shouldn’t forget that the late 2012 top that started the biggest decline of the decade also started with a breakout – on the above chart you can see that as a move above the purple line. Given the situation on the long-term gold and silver charts, and in light of the analogy in terms of size of the previous corrective upswings, it’s doubtful that this breakout will hold.

On a short-term note, we see that gold miners reached the resistance zone created by the mid-2018 tops based on intraday highs and closing prices. So far, the HUI Index was able to move to the July high in terms of intraday prices but it reversed shortly thereafter.
Gold stocks closed the week above their January highs, so we have a bullish sign here. At the same time, however, they formed another daily reversal and they underperformed gold by not managing to close the day higher. The RSI was just close to 70 and we have a new sell signal from the Stochastic indicator.
Summing up, the short-term outlook looks rather unclear, but the big picture continues to point to lower prices. It seems that we will see short-term confirmations of the bearish case rather sooner than later. It also appears appropriate to wait for them before making changes to one’s trading capital, because – after all – the breakout above the January highs was confirmed.
Want free follow-ups to the above article and details not available to 99%+ investors? Sign up to our free newsletter today!
Author

Przemyslaw Radomski, CFA
Sunshine Profits
Przemyslaw Radomski, CFA (PR) is a precious metals investor and analyst who takes advantage of the emotionality on the markets, and invites you to do the same. His company, Sunshine Profits, publishes analytical software that any


