Gold makes history, climbs to $4,050 despite Dollar strength
- Strong Bullish Rally Takes Gold to Historic High $4050.
- Dollar Index shows resilience, rises to 98.98.
- Gold shows mild retracement consolidating above $4032.
- Markets await FOMC meeting minutes.

Fundamental drivers
With no news of agreement in Congress for solution in US Government shutdown, political and fiscal uncertainties take centre stage.
Political turbulence in France adds to global concerns already affecting investor sentiments.
Continuous Gold buying by global central banks as well as ETF inflows creating strong structural demand and triggering FOMO driven rally.
Markets abuzz with talks of massive bubble building up in leading stocks and Indices.
Growing expectations of another rate cut by Federal Reserve in this month and also in December.
Safe haven demand causing Gold rush in run to safety boosting prices to record rally.
Technical drivers
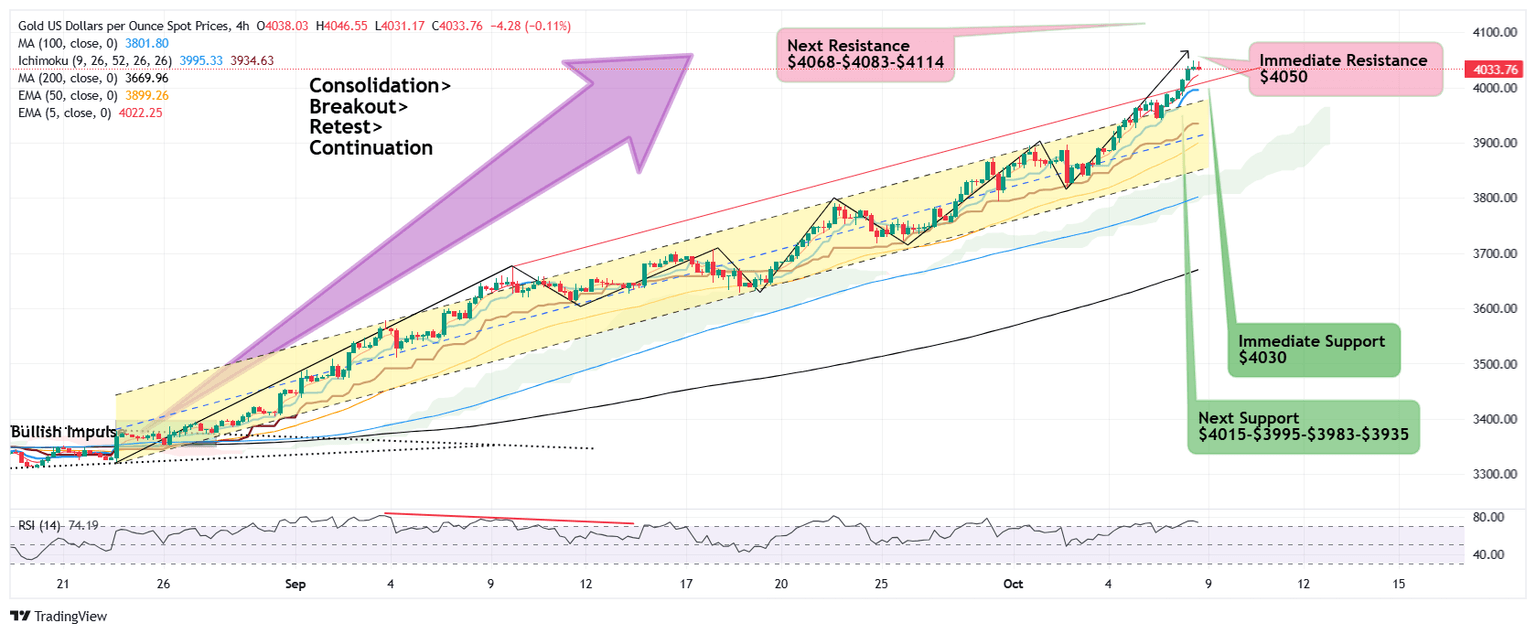
$4050 acts as minor hurdle which bulls need to clear turning in to support for advance towards next leg higher $4068 followed by $4083 while major upside target sits at 2.618% Fibonacci extension aligned with $4114.
Break below immediate support $4032 exposes next support $4015, followed by retracement to $4005-$3995, where buyers are very likely to re engage for renewed bullish rally.
If $3995 fails as support, decline is likely to extend to $3983 below which next downside retracement may reach $3935.
What's most likely scenario?
Prevailing momentum is precisely bullish and immediate price action indicates strong bullish bias while oscillators are highly stretched and anyy positive news of agreement on US Government shutdown will witness quick price correction as these heights are prone to profit booking at the drop of a hat.
High probability that Gold retracement approaches or mitigates $4015-$4005 or even $3995-$3983 support and breakout zone and attracts buyers again to resume main bullish rally retesting $4050 and extending advance towards $4068-$4083 followed by critical resistance $4114.
On the flip side, sharp and strong break below $3983 may also indicate sellers intervention pushing prices to lower boundary $3935.
Author

Sunil Kumar Dixit
SK Charting
Sunil Kumar Dixit is Chief Technical Strategist and founder of SK Charting, a research firm based in India. He tracks Precious Metals, Energy, Indices and Currency Pairs. He also participates as an expert panellist on Channel Television, Nigeria.


