Gold Looking to Chart Trough on Weekly

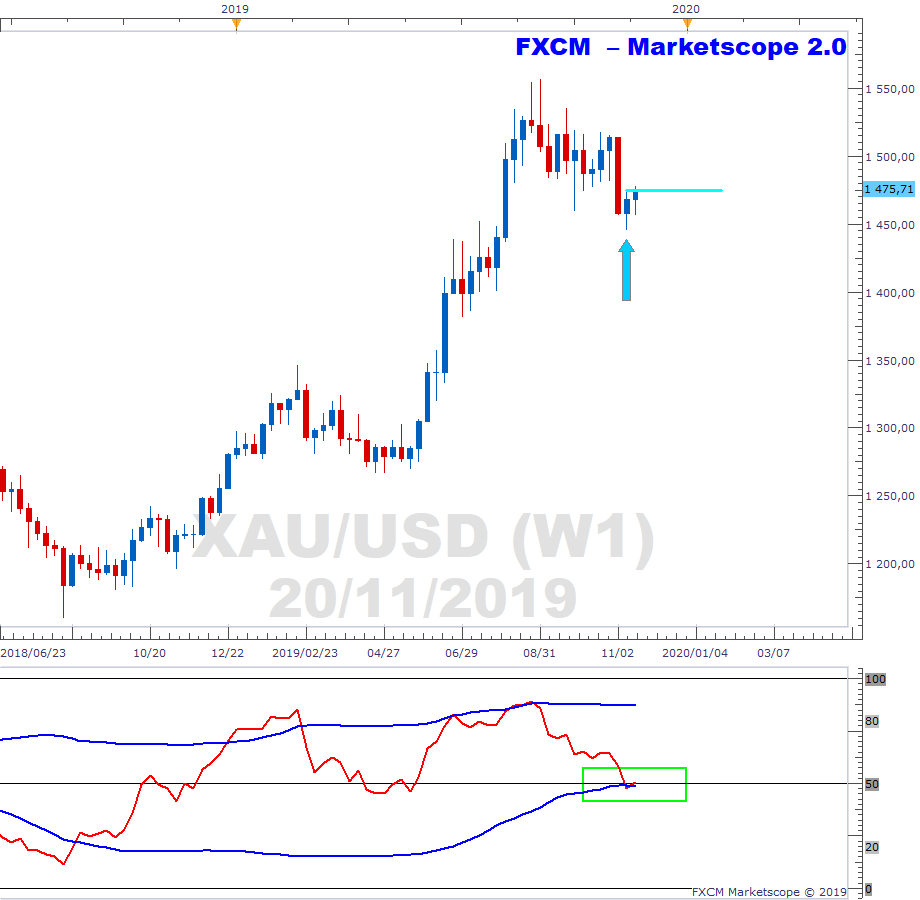
The below is the weekly chart of XAUUSD. Given that the risk markets are generally overbought it is instructive to consider gold. One would imagine that as capital leaves the risk markets, and as their oscillators normalise, that it will find a new home in havens. To this end, gold may be charting a turning point. We note that last week's candle may be a bullish reference candle i.e. a candle with the lowest low in at least a 3-candle cluster. Price this week has moved above last week’s high, but it will need to close above it to give real weight to the bullish reference candle scenario. On a relative level, the precious metal’s RSI was oversold and is now correcting (green rectangle). We continue to monitor.
Past performance is not an indicator of future results.
CHART SOURCE: FXCM MARKETSCOPE 2.0
Author

Russell Shor (MSTA, CFTe, MFTA) has an Honours Degree in Economics from the University of South Africa and holds the coveted Certified Financial Technician and Master of Financial Technical Analysis qualifications from the Interna


