Gold looking stronger than the USD

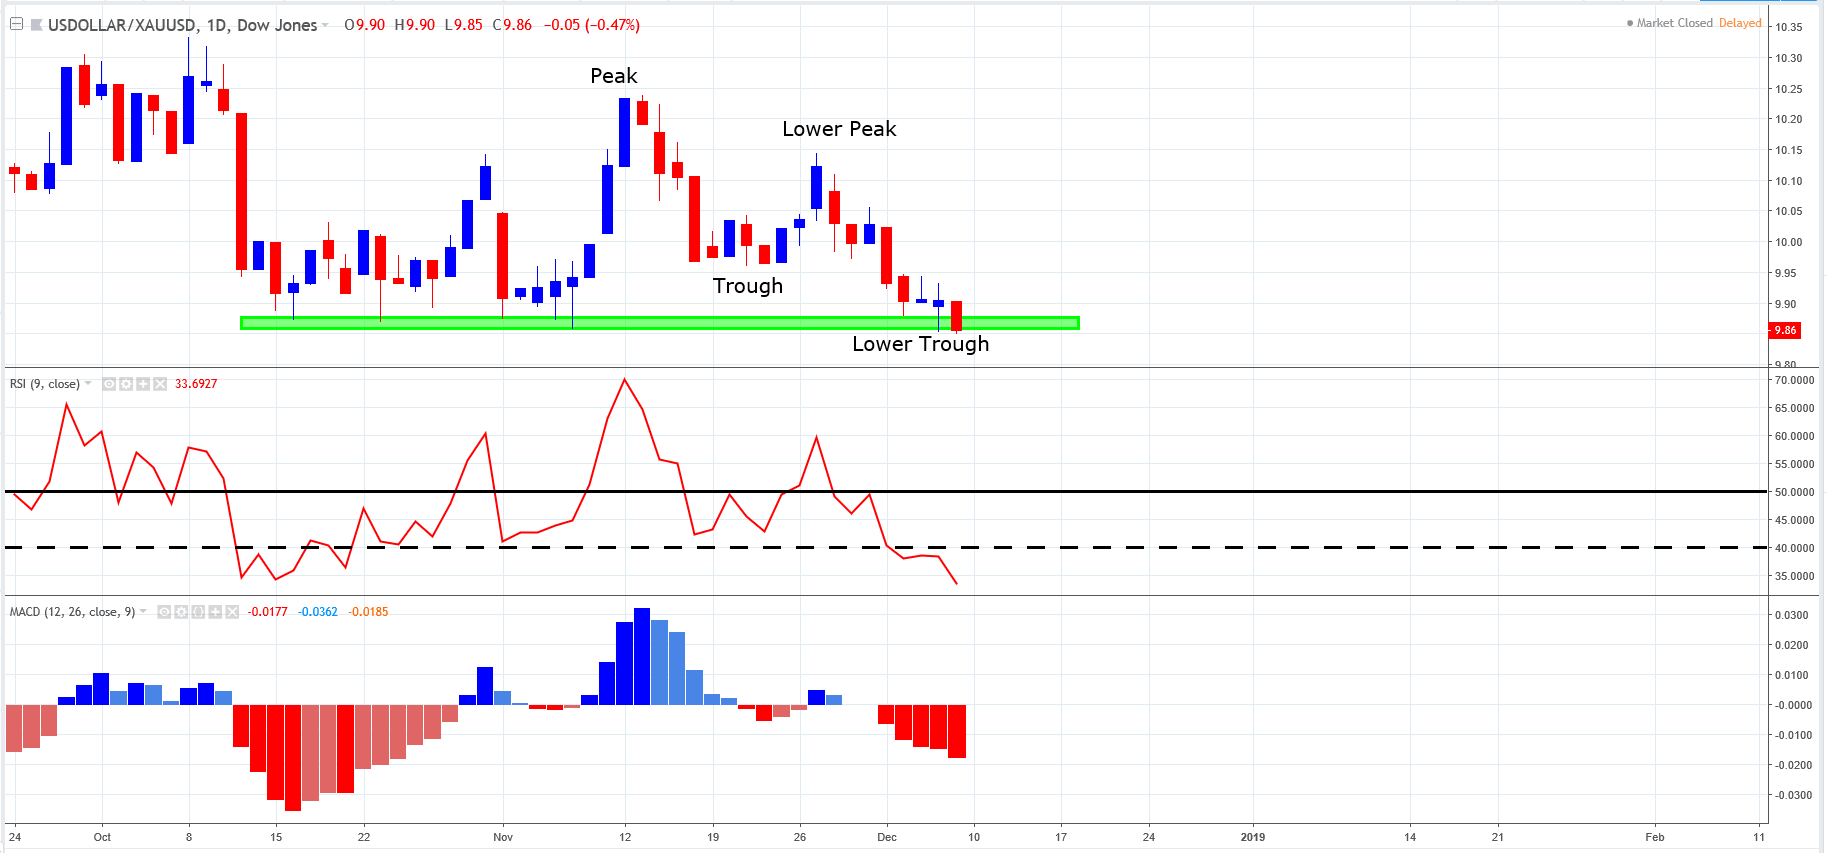
The above chart shows daily price action of USDOLLAR:XAUUUSD. The ratio has charted a lower peak followed by a lower trough. This is the classical definition of a downtrend. The RSI(9) is below 50 and is bearish. The MACD histogram is below zero. This implies that gold is outperforming the greenback. The ratio is at underlying support (green shaded horizontal). As it stands, the support level is holding. We are assessing if the underlying momentum will take the ratio below this level.
Author

Russell Shor (MSTA, CFTe, MFTA) has an Honours Degree in Economics from the University of South Africa and holds the coveted Certified Financial Technician and Master of Financial Technical Analysis qualifications from the Interna
More from Russell Shor, CFTe, MFTA


