|

Gold Is Looking Bright

Chaos Clinic for 12/6/2019

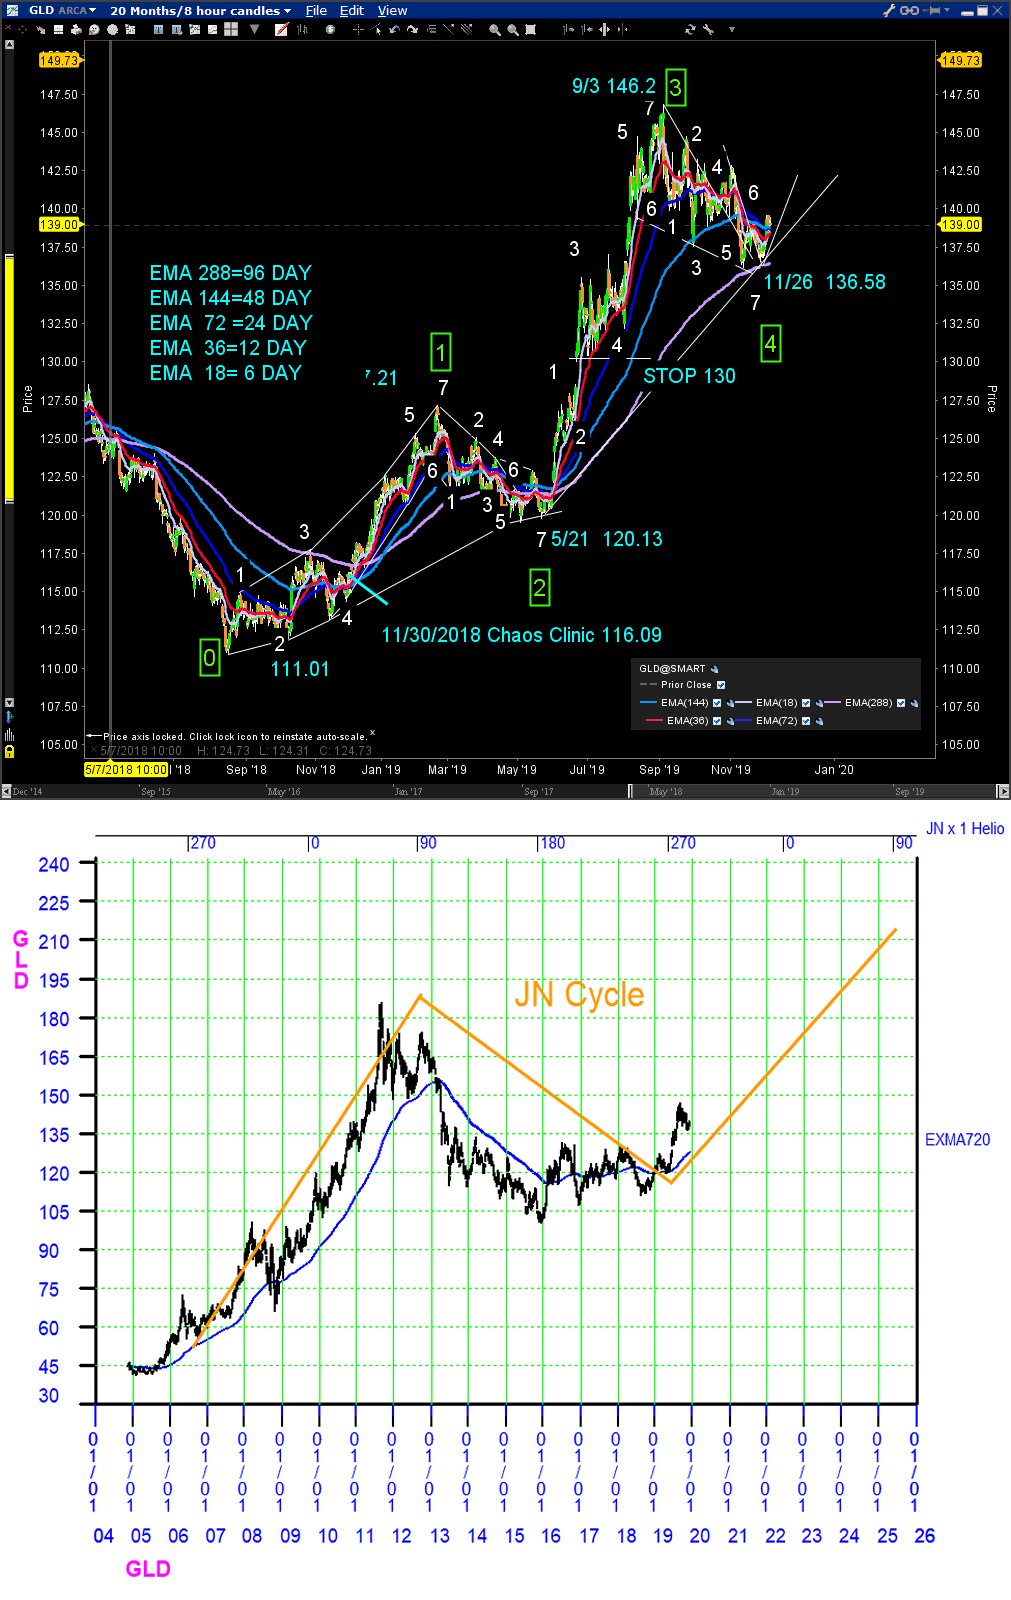
My 11/30/2018 Chaos Clinic pointed out that the gold Exchange Traded Fund GLD looked like it was going to rally. Now, a year later, it is poised to rally more.

The top chart shows an 8 hour bar chart covering 20 months. For the move starting at point 0, prices have traced out moves 1, 2,3, and now 4 of 7 in an up Chaos Clamshell. Inside each of these moves are smaller 7 move fractals.

A rainbow of exponential moving averages helps indentify moves. On this chart the 288 bar EMA filters a 96 day cycle. At move 2, this average was penetrated slightly, but at 4, prices have held above the 96 day EMA. This helps confirm move 4, and also indicates that the move is gaining strength.

The second chart is a multi-year daily chart of GLD. Overlaid on it is the 12.8 year Jupiter-Neptune astro cycle.That cycle shows up as a square in the US gold futures natal chart. The turns are on the squares of the cycle. That this is a valid cycle is shown by the behavior of the 720 calendar day tracking EXMA.

Traders should proceed at their own risk. Stops should always be used. The EXMAs provide stop guidance. On the top chart, a stop under the 96 day EXMA should work,and on the second chart, one under the 720 day is advised.

This content was published on Dr. Al Larson's Chaos Clinic which you can attend each Friday for free.

Dr. Al Larson has developed a complete Chaos Model of Markets, four unique courses that let you become a Certified Chaos Trader, some very unique eMylar fractal pattern overlays, and tools that permit forecasting individual stocks and markets years in advance. You can also sign up for a free weekly email, and attend a free Chaos Clinic on Fridays. To learn more, click on the author's profile.

Be sure to sign up for the free weekly email! 

Author

Dr. Al Larson, PhD

Dr. Al Larson, PhD

MoneyTide.com

Dr. Al Larson holds a Ph.D. in Electrical and Computer Engineering from the University of Wisconsin. He is a 1964 Distinguished Graduate of the U. S. Air Force Academy.

More from Dr. Al Larson, PhD
Share:

Editor's Picks

EUR/USD nears 1.1600 after a volatile day

EUR/USD trades near the 1.1600 mark, boosted late in the American session by news coming from the White House. US President Donald Trump announced a deal with Iran to be signed "soon" by the Middle Eastern country, hinting at probably the weekend. Trump also canceled the planned attacks for Friday.

GBP/USD recovers above 1.3400 on USD selloff

GBP/USD is back firm above 1.3400 with the Greenback giving up most of its weekly gains, following headlines coming from the United States signaling US President Donald Trump signed a proclamation in which he announced that a deal with Iran is pretty much sealed.

Gold jumps above $4,200 on war-relief headlines

Gold surged to fresh intraday highs above $4,200 late in the American afternoon, after US President Donald Trump announced he canceled strikes over Iran, adding an agreement is in its "final stages."

Crypto Today: Bitcoin, Ethereum, XRP rebound broadens despite continued US-Iran strikes

Bitcoin steadies its recovery on Thursday, edging higher toward $63,000 despite incessant capital outflows. Meanwhile, altcoins, including Ethereum and Ripple, exhibit subtle rebound signs, trading above $1,650 and $1.12, respectively.

AI Crypto Forecast: Bittensor, Near Protocol, Internet Computer rebound gains traction 
Cryptocurrency prices are broadly rising on Thursday, following an overstretched downtrend. Despite sticky geopolitical tensions in the Middle East, tokens at the intersection of the blockchain technology and Artificial Intelligence (AI), including Bittensor (TAO), Near Protocol (NEAR) and Internet Computer (ICP) are testing recovery potential.
4.2% headline, 0.2% core: Why the Fed's next hike may be targeting the wrong problem

May's CPI put headline inflation at 4.2% on the year, up from 3.8% in April and the hottest reading since April 2023, while core prices rose just 0.2% on the month, undershooting the 0.3% consensus and halving April's pace.