Gold from another angle

S2N spotlight
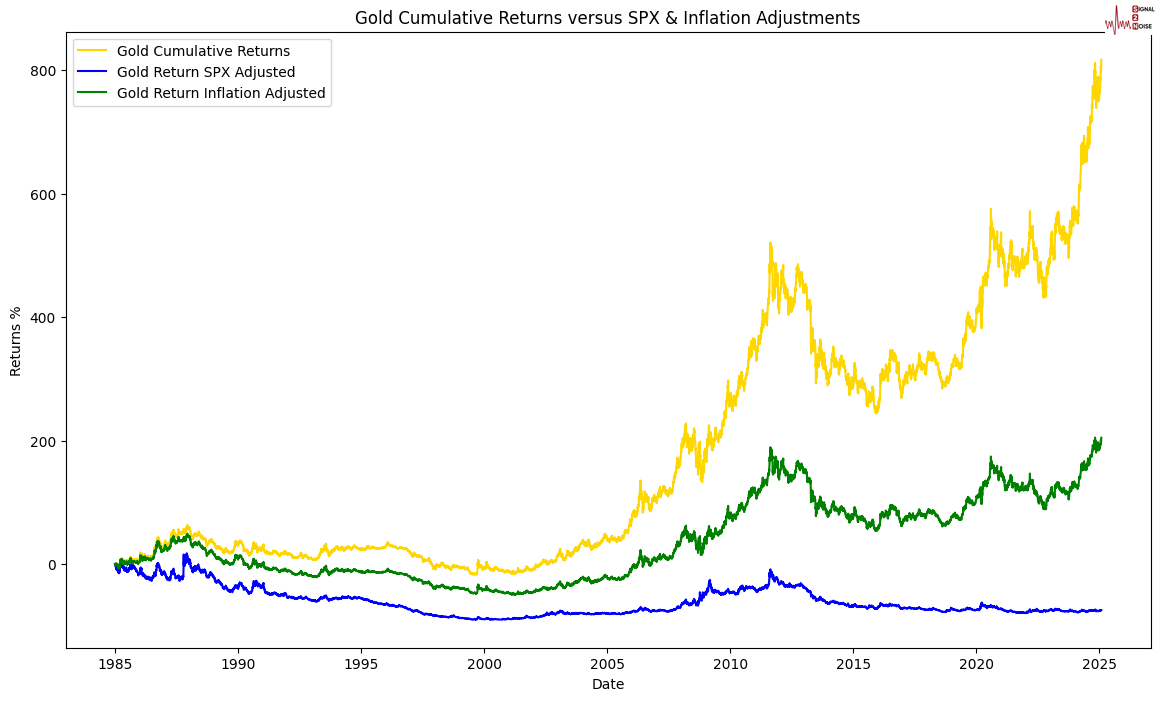
I have seen stock charts adjusted for gold and inflation. I have never seen gold charts adjusted for stocks and inflation. The gold coloured line is well on its way making new highs. What is interesting is that gold adjusted for inflation (green line) has only recently poked above its ATH (all-time high). When it comes to gold in stock terms (blue line) gold has underperformed stocks dramatically since 1985.
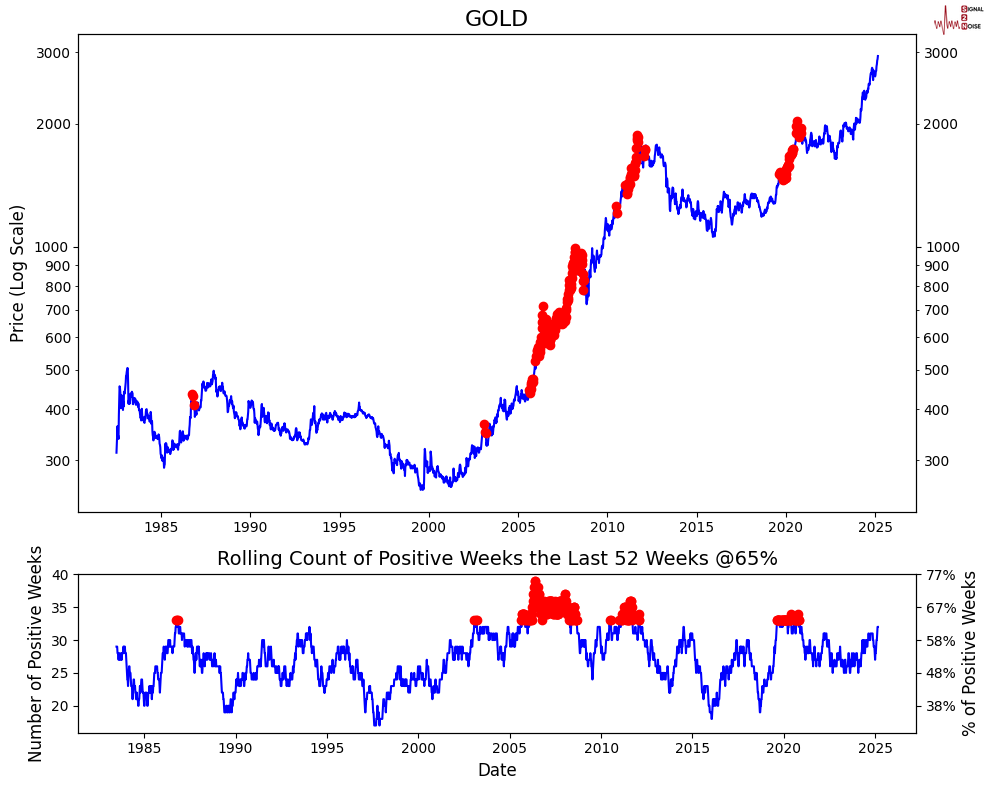
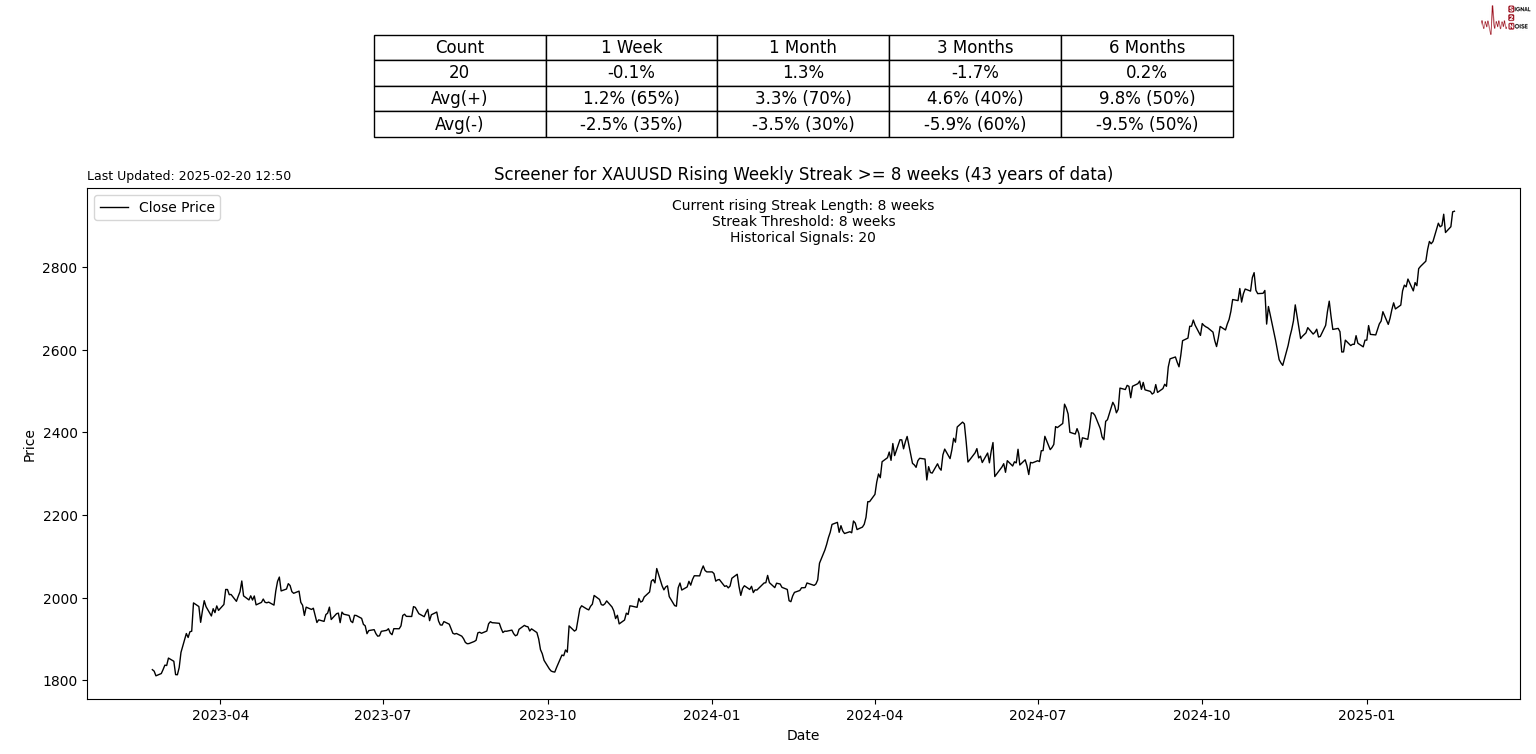
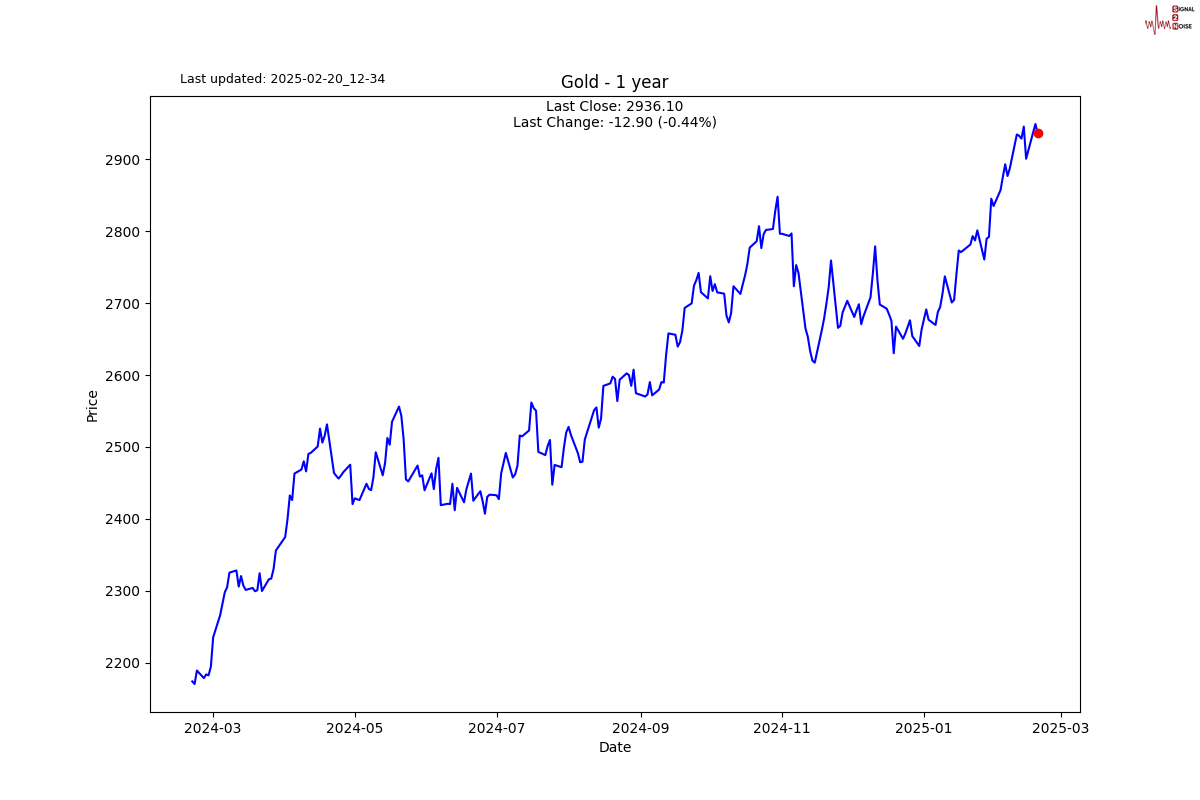
You will see in the screener alerts section that gold is up for 8 weeks in a row. This has only happened 20 times in 43 years. However, I don’t think gold is currently that overbought from a long-term perspective.
Below I have created a chart that looks at how many weeks gold has been positive over the last 52 weeks. If it is above 65% of the time or 32 weeks then I plot a red dot on both plots. We currently don’t have any red dots, which is typical before a short term trend reversal.
S2N observations
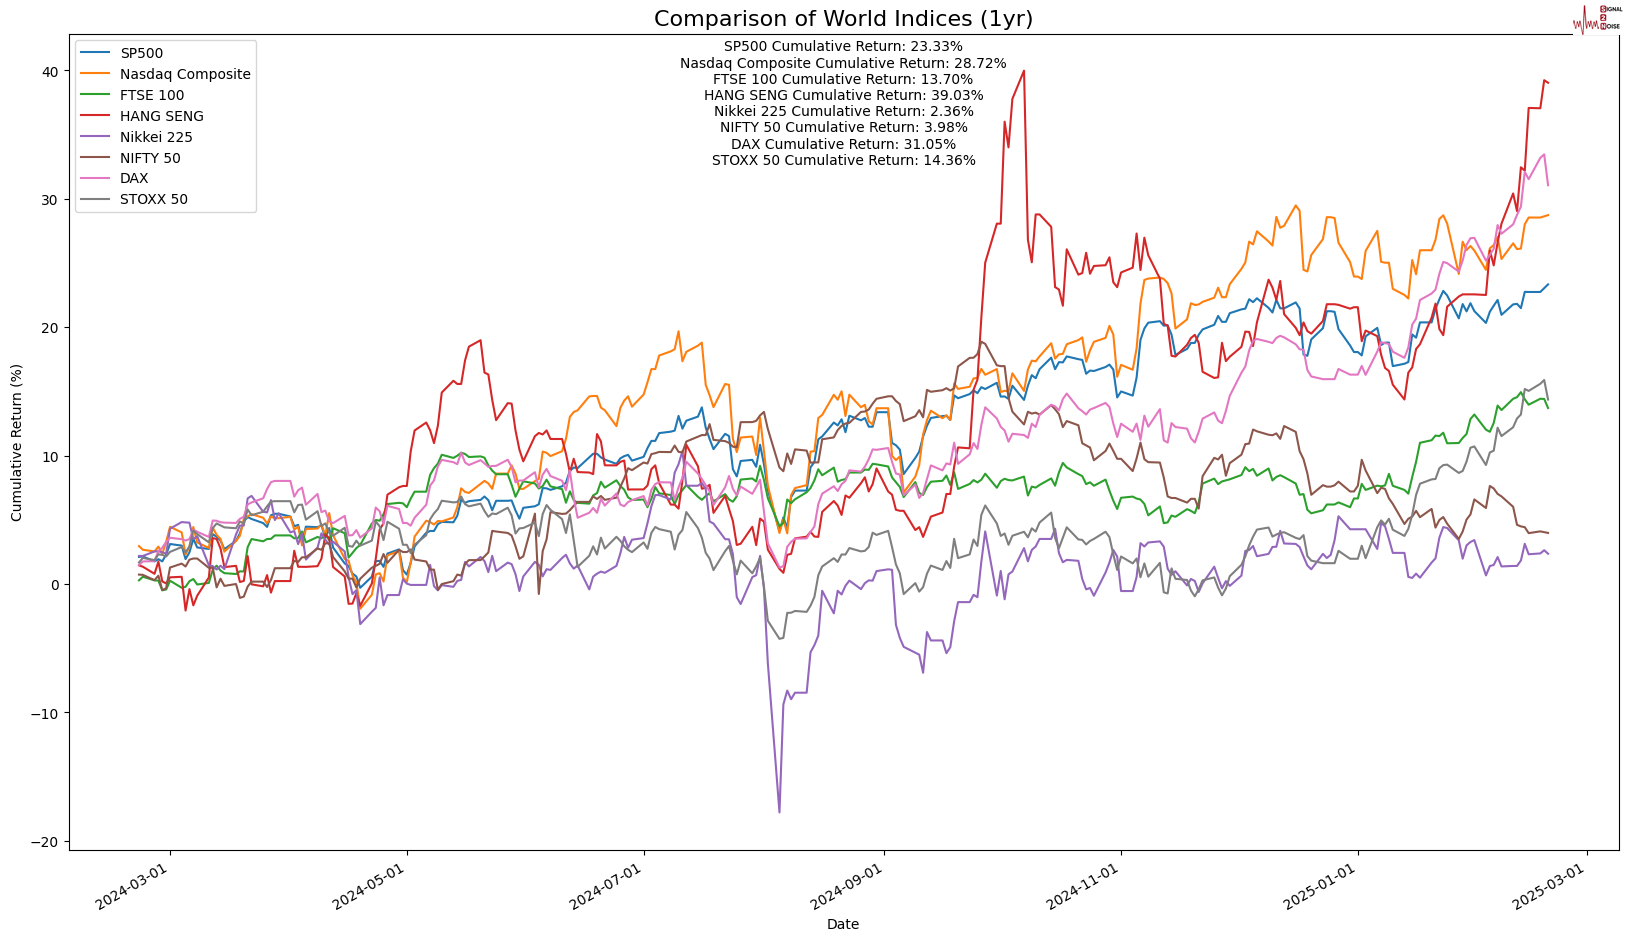
I am currently hearing the term “American Exceptionalism” everywhere I turn. I am not disagreeing but the markets are discounting machines and a lot of that may have been discounted. When looking at performance over the last year the Hang Seng and the German Dax have been outperforming US markets.
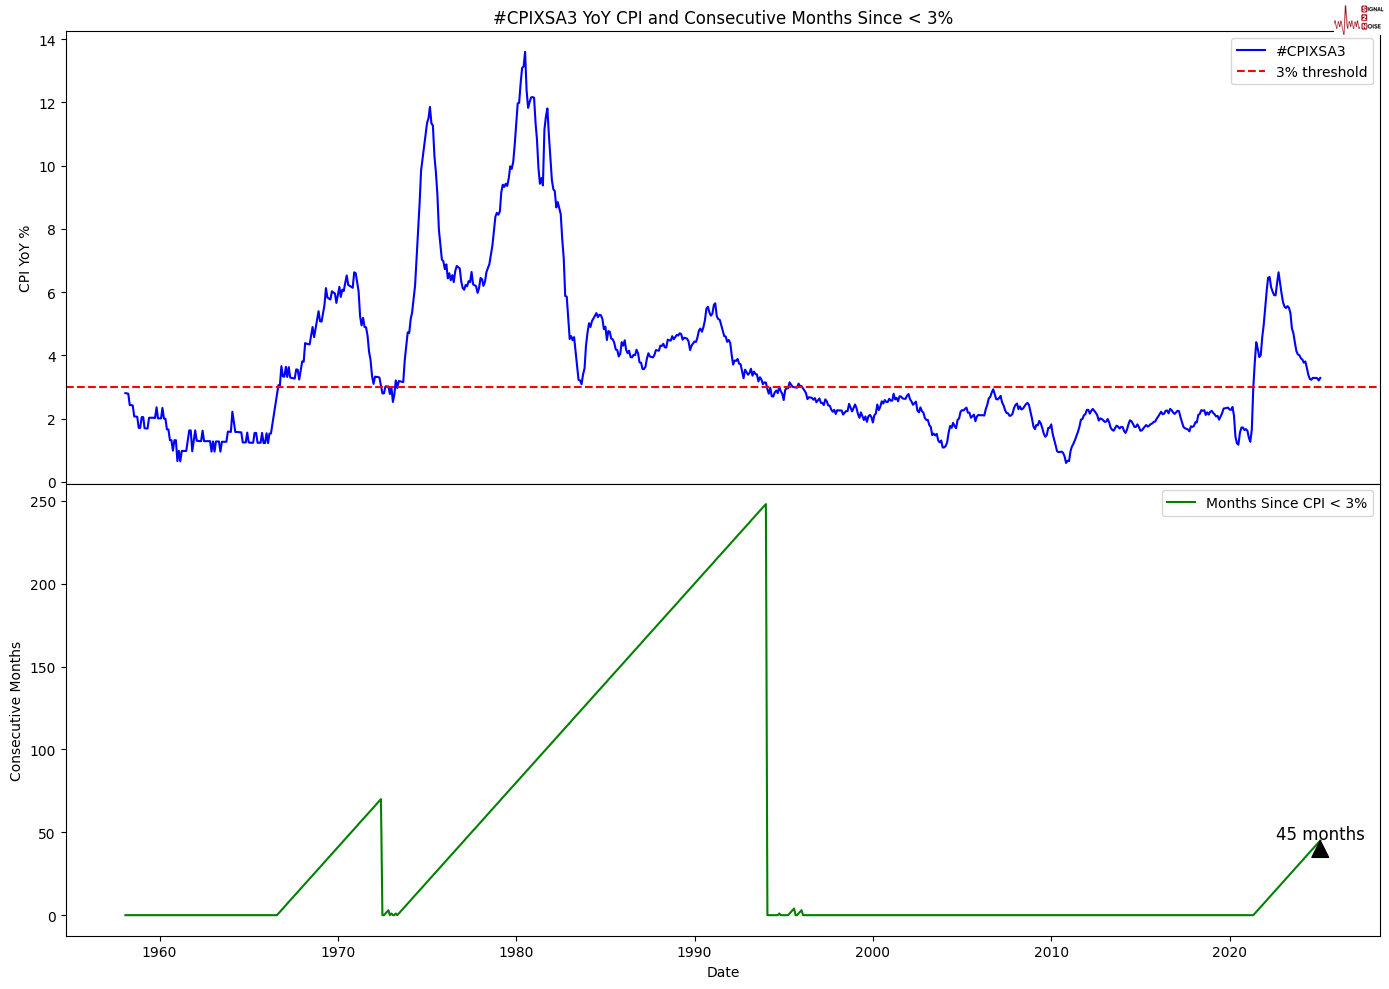
I believe that inflation is going to be a lot stickier and hard to bring down below 3%. As you can see Core Inflation has been above 3% for more than 45 months. The previous cycle took 250 months before taming the beast. There is a lot of inflation expectation in the market, that is very difficult to reverse. Furthermore a large part of the inflation calculation is housing, which is calculated using an imputed value. The Feds numbers are about half of the inflation that the private sector is reporting. This likely means that inflation is higher than what is being reported. Eventually the actual numbers come through and this will likely make inflation even stickier.
S2N screener alerts
Gold has risen 8 weeks in a row for only the 20th time in the last 43 years. Holding it for 3 months from this point has not been a profitable time frame but 1 month has been. A very small sample size to draw strong conclusions.
Performance review
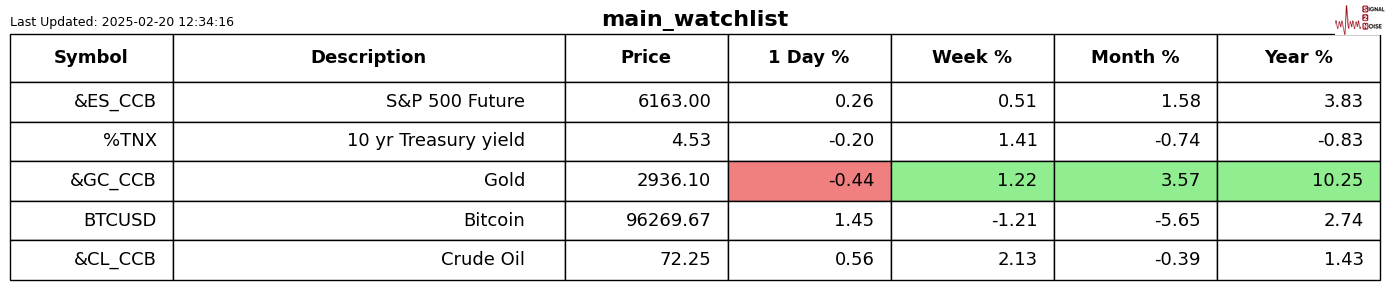
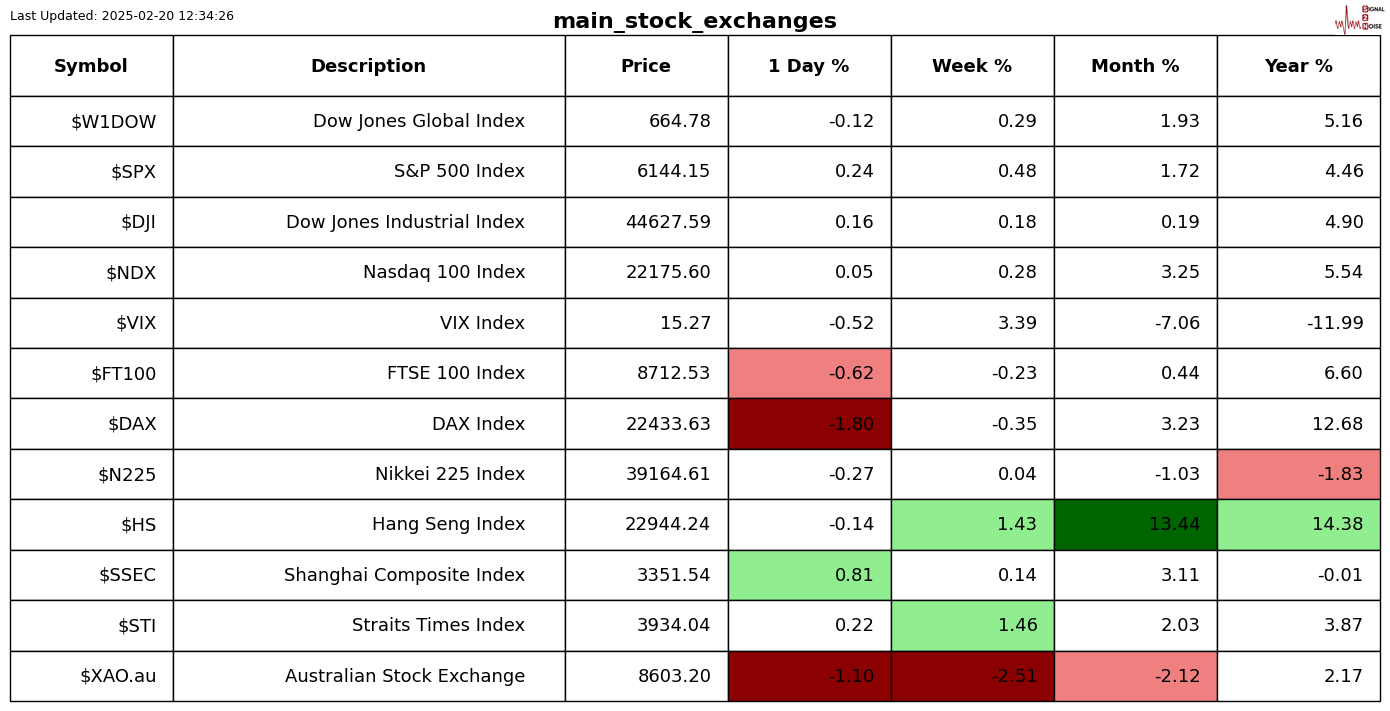
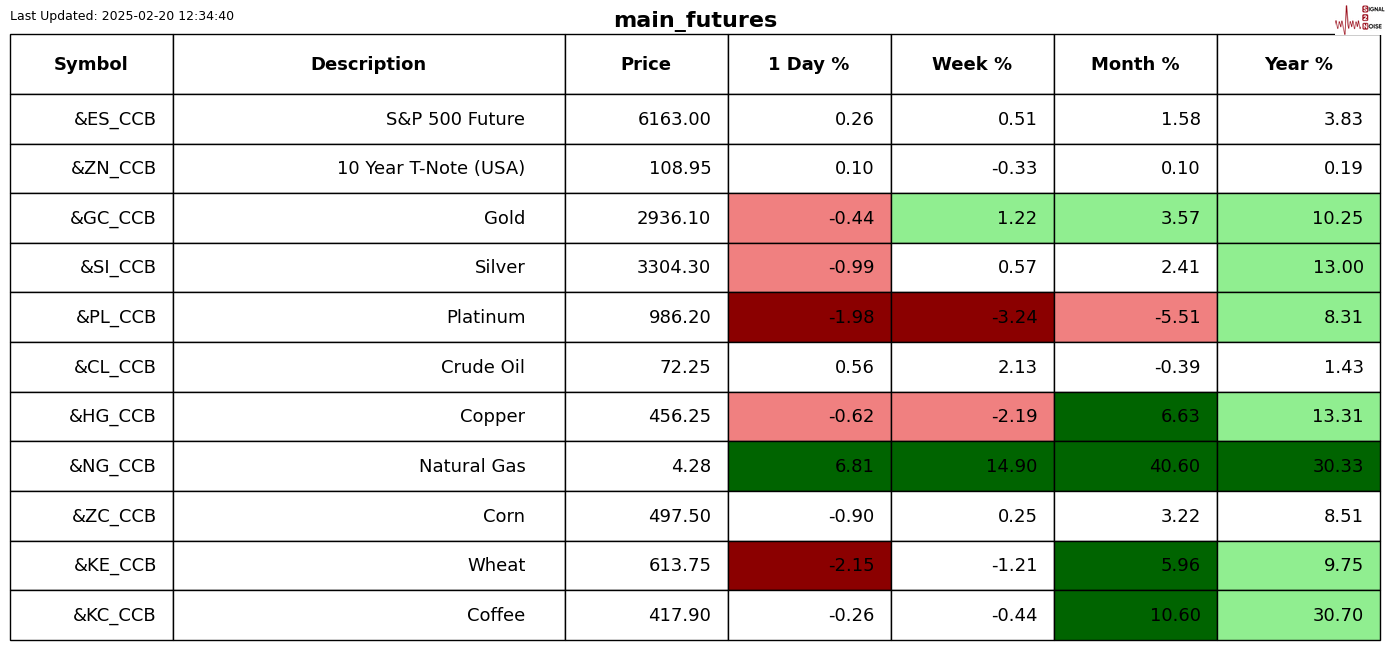
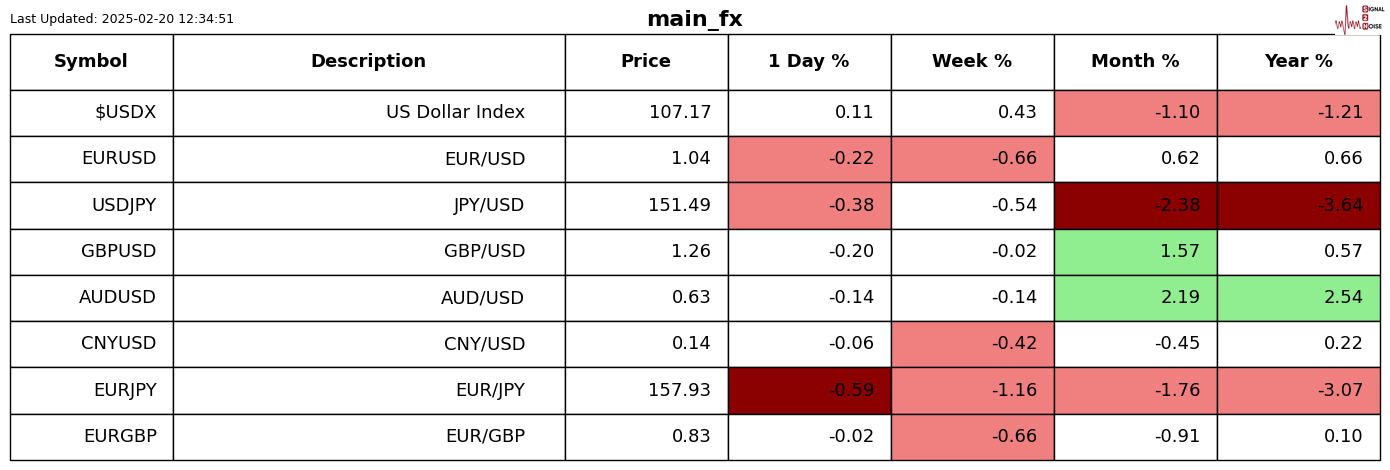
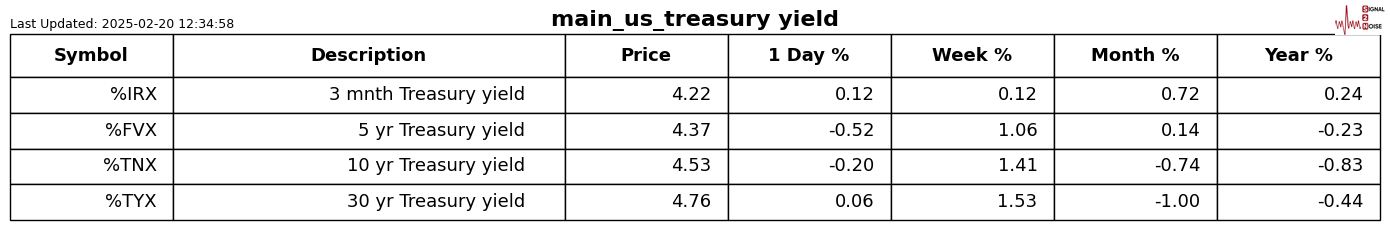
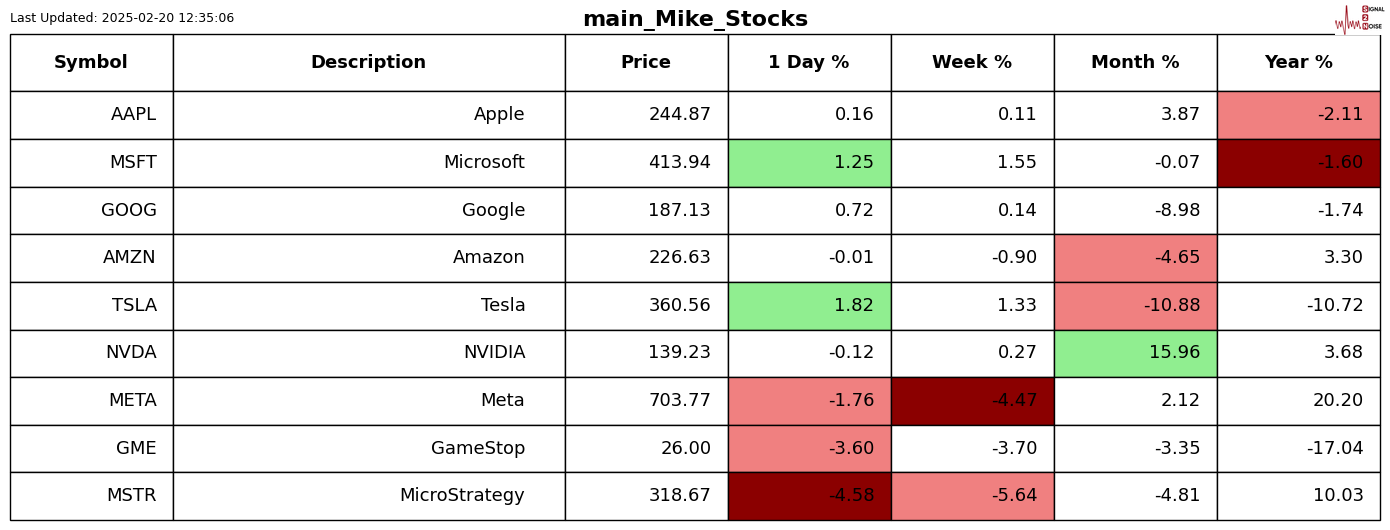
For those who are new to the letter, the shading is Z-Score adjusted so that only moves bigger than usual for the symbol are highlighted.
Chart gallery
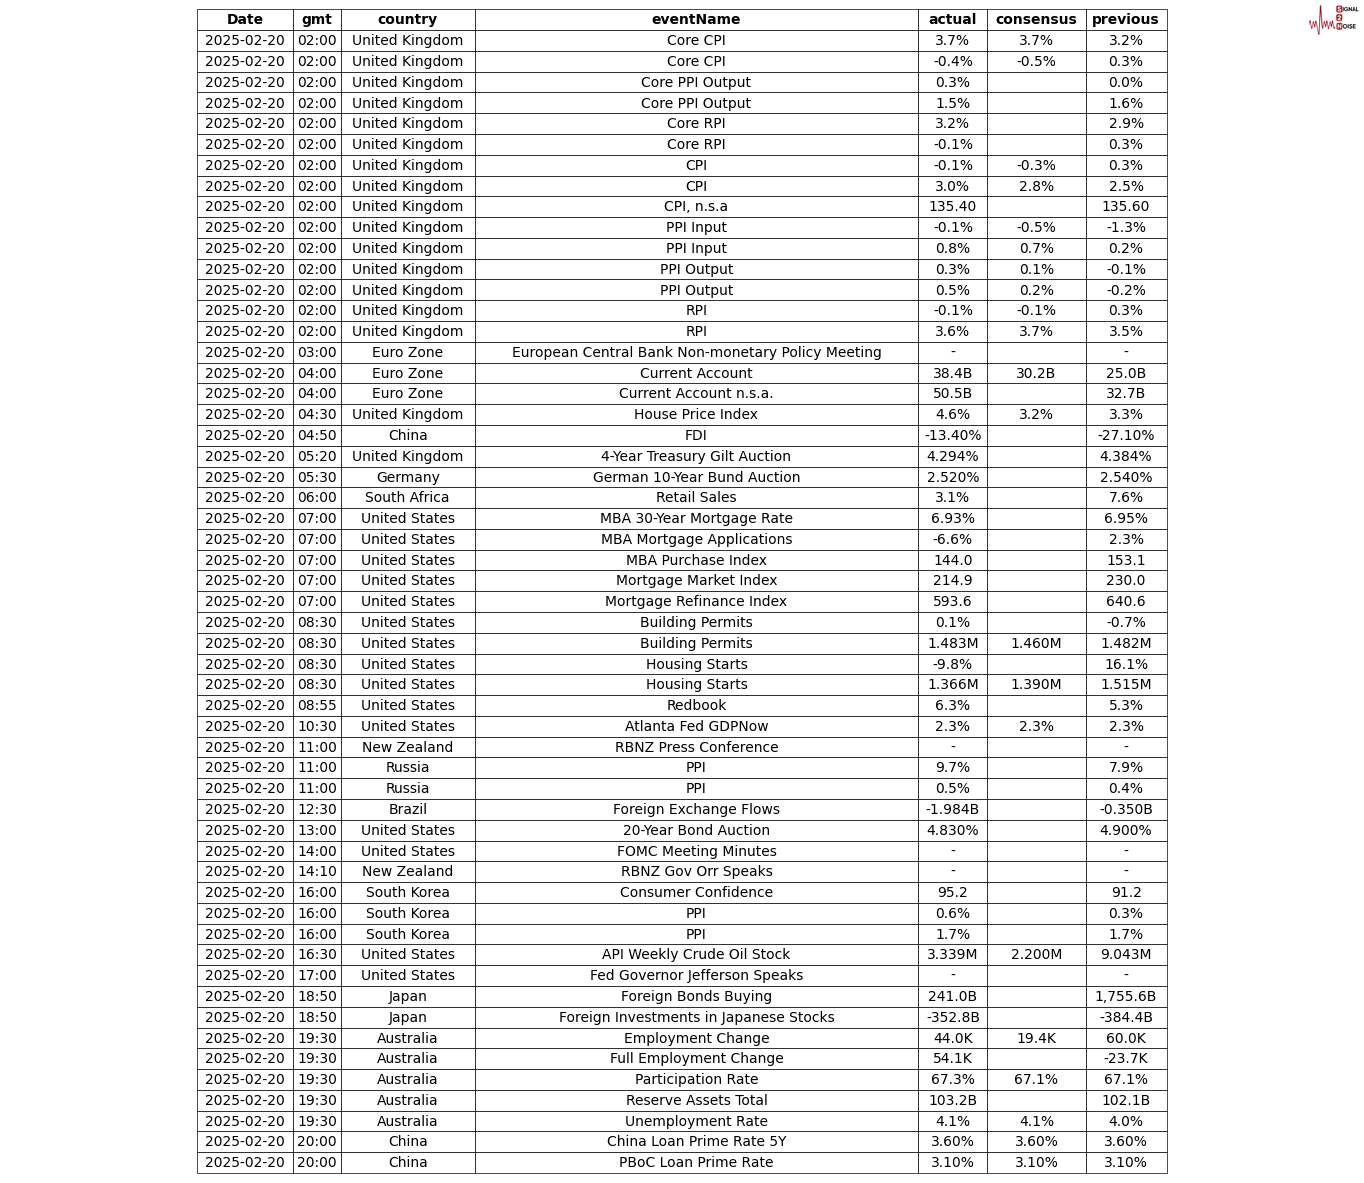
News today
Author

Michael Berman, PhD
Signal2Noise (S2N) News
Michael has decades of experience as a professional trader, hedge fund manager and incubator of emerging traders.


