Gold Forecast H2 2016: Bulls to emerge winners, $ 1500 on the cards?

H1 2016 – A sharp reversal witnessed
After a horrid end to the year 2015, gold staged a solid reversal in the first six months of 2016, having booked the best first half of the year in four decades. The yellow metal climbed 25% in H1 2016, with ‘flight to safety’ emerging the main underlying theme amid increased uncertainty and panic prevalent in across the financial markets.
A turbulent start to 2016, characterized by the Chinese stock markets turmoil in the wake of China’s faltering growth, led to a global financial markets meltdown. Moves in the Chinese yuan, which authorities allowed to weaken in an apparent attempt to bolster flagging exports, heightened alarm about the state of the world’s second-biggest economy. Hence, gold saw a sharp rise above $ 1100 mark in the first month of 2016, as investors flocked to safe-havens in a bid to protect their wealth amid widespread market chaos and panic. Moreover, a surprise move announced by the Bank of Japan (BOJ) also bolstered the recovery in gold. The BOJ adopted negative interest rates policy for the first time ever, in an effort to revive growth in the world's third-largest economy.
Later in February, the recovery gained traction and the precious metal almost neared $ 1250 – key psychological levels, after the world’s second-largest gold consumer, India, announced three gold policy measures (Gold Monetization Scheme, Sovereign Gold Bond and an Indian Gold Coin) in the 2015 budget. Also, gold found support from huge inflows into the gold-backed ETF, to the tune of 200 tons in February, the second highest monthly inflow on record. March witnessed a downward consolidation in the gold prices, but the metal did manage to hold above $ 1200 barrier amid dovish stance adopted by global central bankers, including the Federal Reserve (Fed). The US Fed left borrowing costs unchanged and lowered 2016 forecasts for interest rates at its March policy meeting, squashing expectations of a much-anticipated summer Fed rate hike. And then came the two awful US labour market reports for April and May, which further poured cold water on a Fed rate hike prospects for this year, and thus, drove the yellow metal to fresh fifteen-month tops at $ 1300 levels.
However, the rally soon lost steam as renewed favoritism towards anti-Brexit brought risk-on back into markets. Subsequently, gold lost its shine amid rallying global equities and reducing demand for safe-havens. Towards the end of the second quarter of 2016, gold resumed the upward trajectory and raced to fresh over two-year highs at $ 1358.41, after markets sought refuge to safety nets following the Brexit debacle. Gold soared as much as 8% after Britain delivered a shock vote to leave the European Union in a historic referendum held on June 23rd.
H2 2016 – Eyes on $ 1500 post-Brexit
The post-Brexit global outlook appeared bleak as we stepped into the second half of the year 2016, which lifted gold prices to the highest levels in twenty-seven months at $ 1375.17 in the first week after the Brexit vote. Brexit-related economic and political uncertainty gripped markets, while investors continued to swoon over the US interest rates outlook.
However, with the induction of the new UK PM Theresa May and a Brexit team, Brexit fears soon receded, paving the way for a sharp sell-off in the yellow metal. However, the bulls were rescued by a failed military coup in Turkey, although the recovery was short-lived as odds of a Fed rate hike this year re-emerged, following a run of upbeat US fundamentals released over the past couple of weeks.
Going forward, what remains to be seen is whether Fed lives up to its promise of hiking rates this year amid increasing global growth concerns and geopolitical risks. Hence, the H2 2016 is likely to see the extension of the recovery in gold from almost seven-year lows on expectations of fresh round of central bank easing across the globe.
Factors that may affect gold in H2 2016
US elections: The US presidential election in November is expected to be the next big catalyst for gold, and that is predicted to have more of an impact than the UK referendum. The Republican candidate Donald Trump is racing closer to the Democratic candidate Clinton and markets now believe that Trump’s policies may hinder the US economic growth, which could result in the US markets turmoil pushing safe-haven gold higher.
Analysts at ABN Amro believe, “Gold will see a smooth ride ahead (even if democrats make it to the White House) on prospects of inflation outdoing growth, negative real interest rates and a “longer-term downtrend for the U.S. dollar.”
Central bank easing: Most of the major central banks across the globe are considering easing further or stand pat as they continue to assess the Brexit impact on their economies. The European Central Bank (ECB) left policy steady in July, although may look to ease later this year as the Brexit fallout begins to affect the Eurozone economic fundamentals. The Bank of England (BOE) is widely expected to cut rates to record lows as soon as August as the Brexit impact takes an ugly shape on the economy.
While the Bank of Japan (BOJ) is also widely expected to ease in the upcoming months amid a sharp appreciation in the domestic currency and deteriorating growth prospects. The Fed may refrain from raising rates this year and could adopt a more dovish tone in the months ahead (my personal view) against the backdrop of looming Brexit–related concerns and mounting uncertainties around the US presidential elections.
Rising safe-haven demand: Rise in demand for gold as a hedge on increased exposure towards risk assets as investors search for higher returns amid persisting low yield environment. The stock valuations in the US and across the globe remain elevated and pose a significant risk to markets, which is likely to boost gold on the back of a flight to safety.
Chinese demand: China has been shoring up its gold holdings, increasing central bank gold reserves by 71.4% in the past 12 months, compared with a global increase in central bank reserves of 2.85%. Moreover, in the wake of instability around the Chinese currency, individuals and investment companies have been buying gold, as it is the ultimate store of value.
Gold Technicals: Watch out for a rally to $ 1500 mark
Monthly Chart

Gold bounced off a strong support located between 1040-1050 levels towards 2015 close and kicked-off the year 2016 on a stronger footing, having displayed a falling wedge bullish breakout in the month of February above $ 1215.
In the subsequent months, the prices extended its bullish momentum on a decisive break above the bullish monthly 100-SMA then placed at $ 1267. The bulls took over complete control beyond the last, driving the rate beyond the monthly 50-SMA (then located at 1328 levels) to print fresh more than 2-year peaks just ahead of 1375 levels. The prices ran into the longer-term descending channel trend line resistance (in white) at $ 1377 earlier this month and dropped as low as $ 1310.76, before recovering some ground to now hover around the support-turned resistance of monthly 50-SMA, now located at $ 1323.
The ongoing bearish streak in gold is likely to accentuate below a break of $ 1300 marker, knocking off the prices to test the solid support placed near $ 1279-77 zone, the confluence of monthly 100-SMA, monthly 5-SMA and Fib 38.20% of 1999-2011 parabolic rise. A massive sell-off could be triggered, should the bullion breach the last key support, sending it sharply lower towards the next static support zone located between $ 1200- $ 1185, where the monthly 20-SMA, monthly 10-SMA and 2012 downtrend (falling wedge) trend line resistance (in blue) coincide.
Any dip in the gold prices in the months ahead should be considered a good buying opportunity, as the above-mentioned fundamental drivers are likely to keep the rally alive. Should the Fed turn dovish this year or Trump win the US presidential elections, we could see fresh buying in the yellow metal, which could trigger a bullish break from the falling channel formation, taking this year-end rally all the way back to April 2013 levels around $1475-$1525.
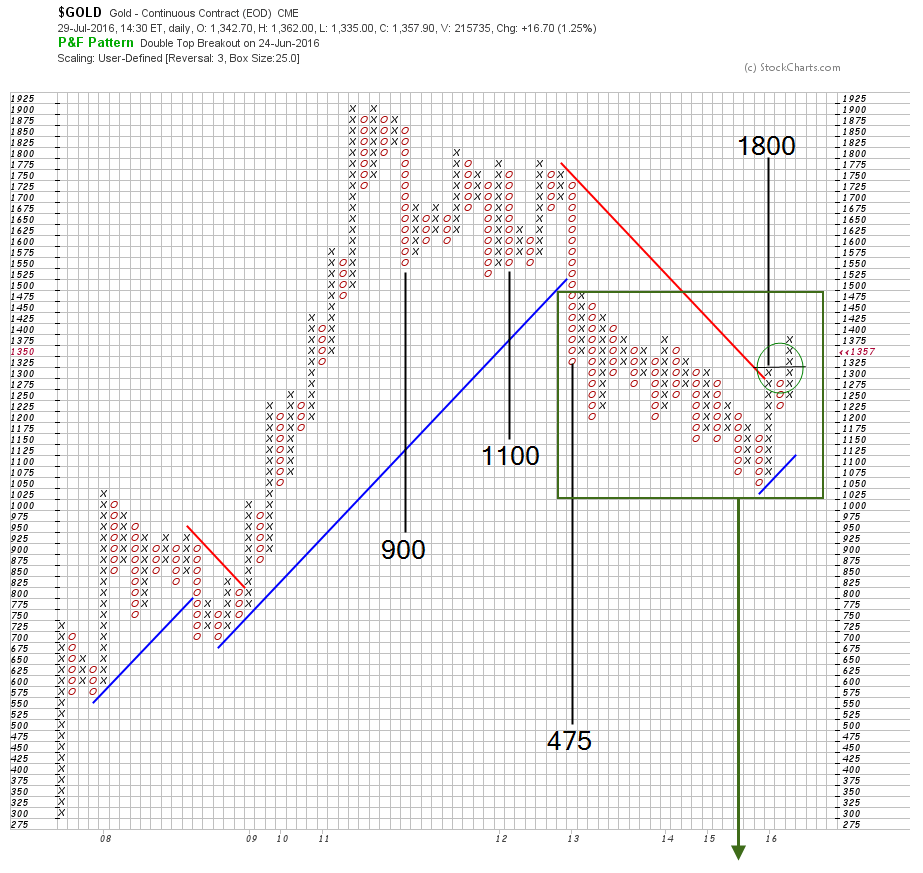
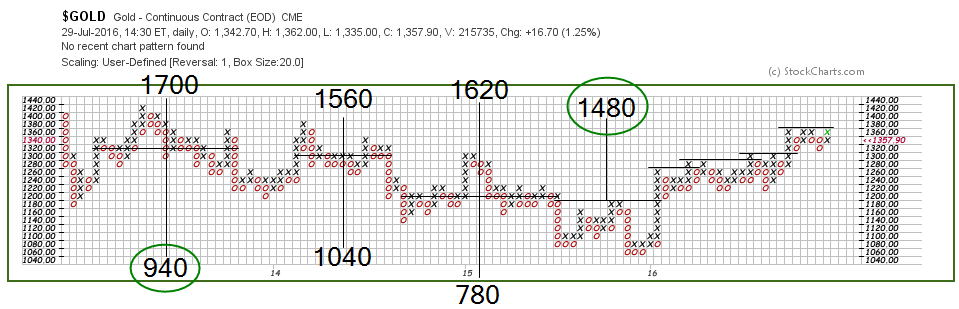
Gold Point & Figure Chart, by Gonçalo Moreira, CMT
Author

Dhwani Mehta
FXStreet
Residing in Mumbai (India), Dhwani is a Senior Analyst and Manager of the Asian session at FXStreet. She has over 10 years of experience in analyzing and covering the global financial markets, with specialization in Forex and commodities markets.


