Gold Forecast: Gains could be transient

Currently, gold (XAU/USD) is up 0.53 percent at $1342, but the gains could be short-lived, price chart indicates.
Price action in the last 24 hours
Ysterday's rebound from $1335.49 (4-hour 100-MA yesterday) ran out of steam at a high of $1348 as expected. However, the ensuing price drop again found bids at 4-hour 100-MA.
4-hour chart
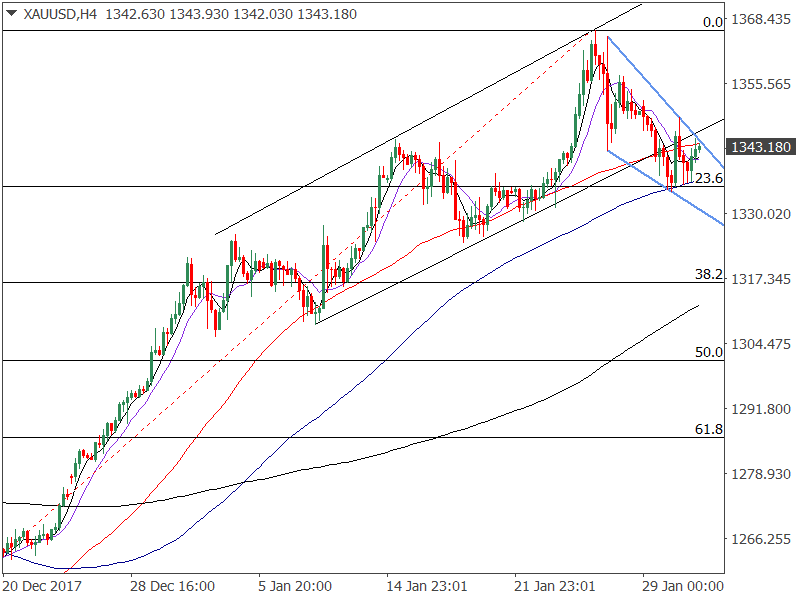
As seen in the chart above, three out of the previous five 4-hour candles show prices bounced-off from the 4-hour 100-MA support. So, the falling wedge could be breached on the higher side, signaling the revival of the bullish move.
However, the daily chart still favors the bears. As seen below, the bearish price RSI divergence yielded a downside break of the rising channel yesterday and despite the rebound from the strong support of the 4-hour 100-MA, the yellow metal is finding it hard to cut through the resistance offered by the 5-day MA and the rising trendline (former rising channel support now acting as resistance).
Daily chart
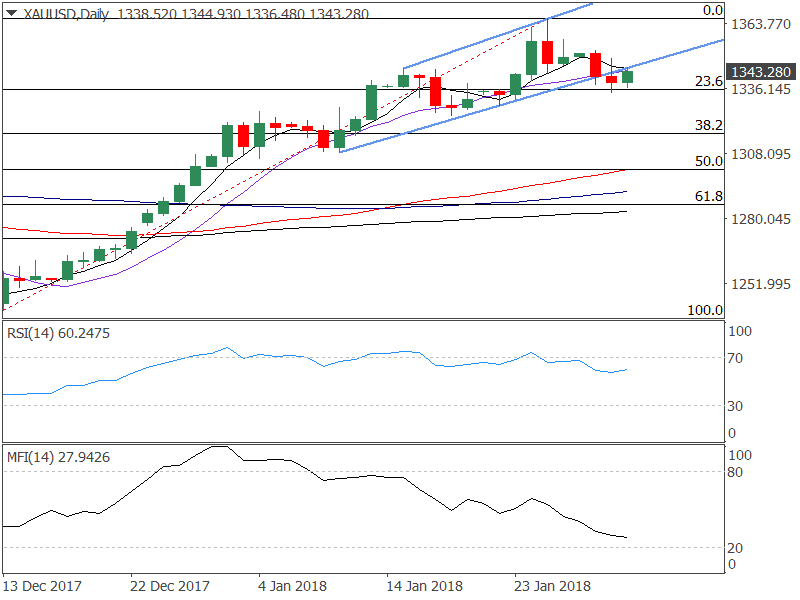
Further, the money flow index (which combines the momentum and volume with an RSI formula) continues to lose altitude, suggesting a strong bearish bias. Also, yesterday's close was below $1344.75 (Jan. 15 high) and also marked a downside break of the rising channel.
Thus, gains seen today could be short-lived. Rejection at the confluence of 5-day MA and the rising trendline (former rising channel support now acting as resistance) if followed by a break below $1335 could yield a quick-fire drop to $$1316 (38.2% Fib R of Dec-Jan rally). On the higher side, only a daily close above $1352 (Jan. 29 high) would revive the bullish view.
Author

Omkar Godbole
FXStreet Contributor
Omkar Godbole, editor and analyst, joined FXStreet after four years as a research analyst at several Indian brokerage companies.


